
Statistical summary: Marine transportation occurrences in 2014
Table of contents
Foreword
This document provides Canadians with an annual summary of selected marine safety data. It covers commercial vessels, which include all vessels registered or licensed to operate commercially. Pleasure craft occurrences are not normally included unless they also involve a commercial vessel. The Transportation Safety Board of Canada (TSB) gathers and uses this data during the course of our investigations to analyze safety deficiencies and identify risks in the Canadian transportation system.
In November 2013, the TSB deployed a new Marine Occurrence Database. The new database significantly improves the TSB’s ability to collect, categorize and present statistics. In accordance with these changes the 2014 statistical summary onward will be presented in a slightly different format.
During the conversion to the new database, the TSB took the opportunity to refine the existing taxonomy used to classify occurrences and remapped historical data to this new taxonomy. These changes were made to improve the alignment of historical marine occurrence data with the new TSB regulations. These updates will allow the TSB to collect data more effectively and enable data to be compared across the adjusted years, thus giving a better picture of safety issues going forward. On March 12, 2014, the TSB implemented new regulations that changed the reporting requirements effective July 1, 2014. These changes are reflected in this statistical summary.
Users of these statistics are advised that, in a live database, the occurrence data are constantly being updated. Consequently, the statistics may change slightly over time. Further, as many occurrences are not formally investigated, information recorded for some occurrences will not have been verified. The 2014 statistics presented here reflect the TSB database updated as of February 27, 2014.
To enhance awareness and increase the safety value of the material presented in the Statistical Summary – Marine Occurrences 2014, readers are encouraged to copy or reprint the data presented, in whole or in part, for further distribution (with acknowledgements of the source).
The TSB is an independent agency operating under its own Act of Parliament. Its sole aim is the advancement of transportation safety.
Comments on this document can be forwarded to the following address:
Transportation Safety Board of Canada
Communications Branch
Place du Centre
200 Promenade du Portage
4th Floor
Gatineau, Quebec
K1A 1K8
Telephone: 819-994-3741
Facsimile: 819-997-2239
E-mail: communications@bst-tsb.gc.ca
Accidents
Overview of accidents and casualties
In 2014, 301 marine accidentsFootnote 1 were reported to the TSB, down from the 2013 total of 323 and down from the 2009–2013 average of 336. Over the past 10 years, 85% of marine accidents were shipping accidents, while the remainder were accidents aboard ship.
There were 249 shipping accidents in 2014, down 5% from the 2013 total of 262 and down 12% from the 2009–2013 average of 281.
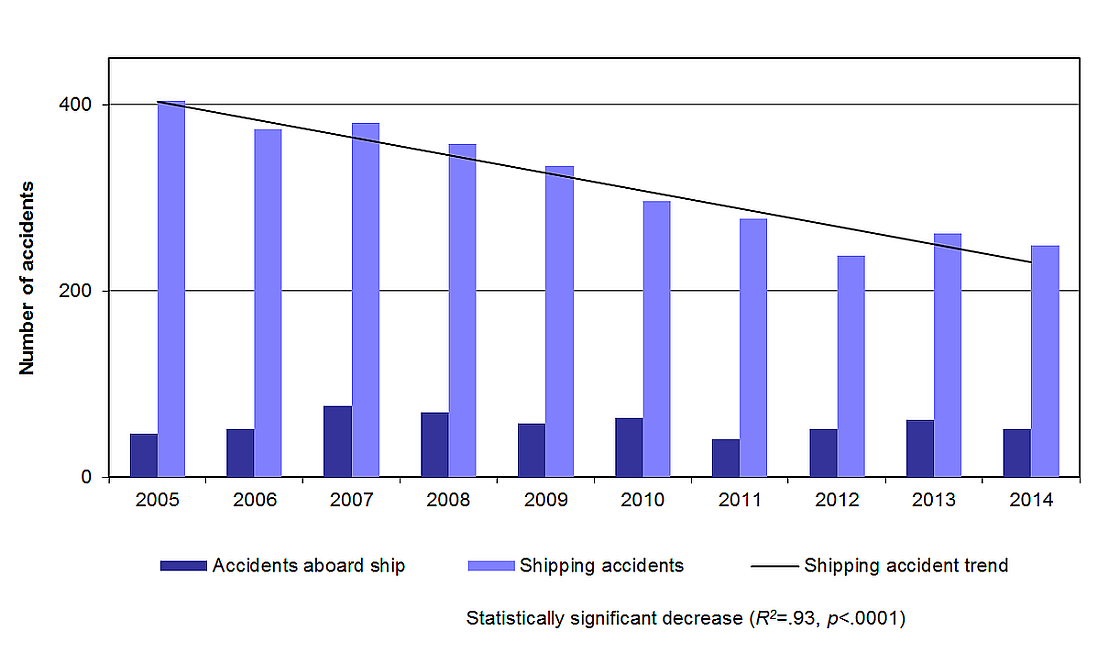
Figure 1 data
| Year | Shipping accidents | Accidents aboard ship |
|---|---|---|
| 2005 | 404 | 47 |
| 2006 | 374 | 52 |
| 2007 | 380 | 76 |
| 2008 | 358 | 69 |
| 2009 | 334 | 57 |
| 2010 | 296 | 63 |
| 2011 | 277 | 41 |
| 2012 | 238 | 52 |
| 2013 | 262 | 61 |
| 2014 | 249 | 52 |
In 2014, there were 52 accidents aboard ship, down from 61 in 2013 and down from the 2009–2013 average of 55. The majority of accidents aboard ship occurred on cargo vessels (40%) and fishing vessels (35%).
Marine fatalities totalled 12 in 2014 (Figure 2), down from a total of 19 in 2013 and down from the average of 16 in 2009–2013. Fishing vessels accounted for 2 of the 4 shipping accident fatalities in 2014. In addition, accidents aboard fishing vessels led to 6 of the 8 accident aboard ship fatalities. In total, there were 8 fishing vessel fatalities in 2014, down from the annual average of 12 in 2009-2013.
Serious Injuries in 2014 totalled 46, down from 50 in 2013 and down from the annual average of 54 in 2009–2013. Forty-five of the 46 serious injuries resulted from accidents aboard ship.
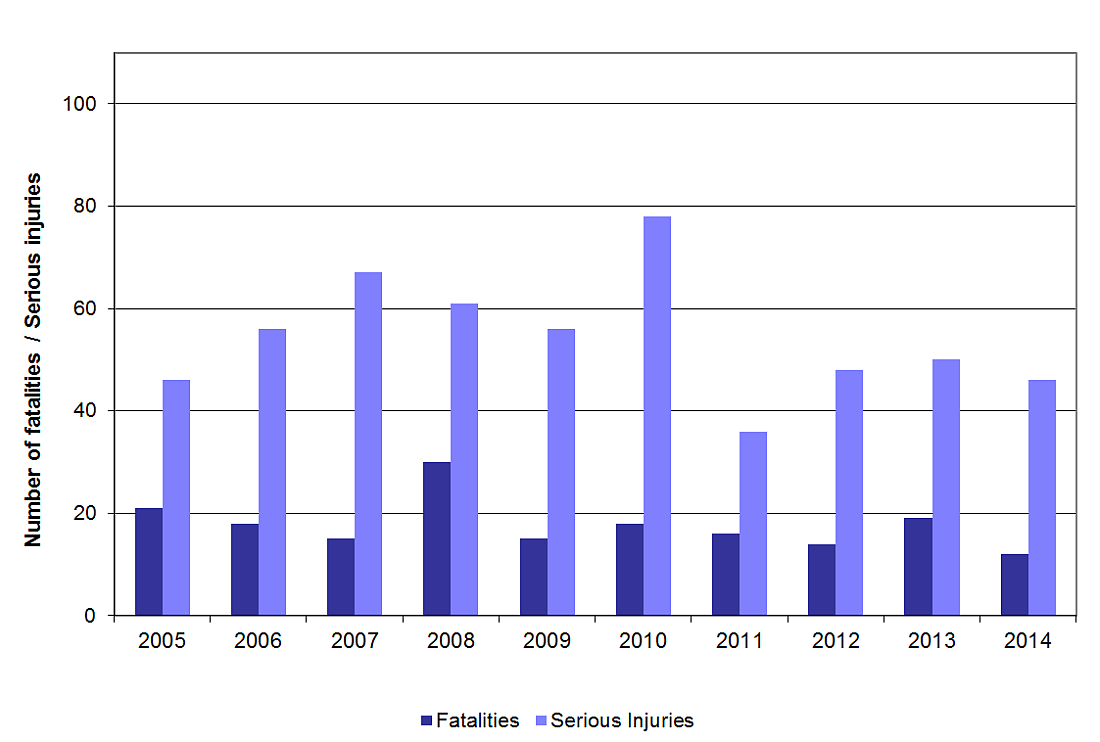
Figure 2 data
| Year | Fatalities | Seriously injured |
|---|---|---|
| 2005 | 21 | 46 |
| 2006 | 18 | 56 |
| 2007 | 15 | 67 |
| 2008 | 30 | 61 |
| 2009 | 15 | 56 |
| 2010 | 18 | 78 |
| 2011 | 16 | 36 |
| 2012 | 14 | 48 |
| 2013 | 19 | 50 |
| 2014 | 12 | 46 |
Shipping accidents
Type of accident (Table 1):
As illustrated in Figure 3, the most frequent types of shipping accidents in 2014 were collisions (35%), groundings (24%), sustains damage rendering unseaworthy/unfit for purpose accidents (16%), sank (15%), and fire/explosion accidents (12%). The total number of collisions increased by 13% from the five-year average (from 78 to 88), while groundings decreased by 27% (from 83 to 61). Sustains damage rendering unseaworthy/unfit for purpose accidents increased by 46% (from 28 to 41). This increase may be attributable to a longer ice season in 2014 causing more ice damage to vessels, and to some shorter ice seasons within the previous five-year period. Fire/explosion accidents decreased by 33% compared to the five year average (from 44 to 29).

Figure 3 data
| Accident type | 2005–2013 average | 2014 |
|---|---|---|
| Capsize | 10 | 3 |
| Collision | 86 | 88 |
| Fire/Explosion | 50 | 29 |
| Grounding | 87 | 61 |
| Sank | 54 | 26 |
| Unfit | 35 | 41 |
| Other | 3 | 1 |
Type of vessel (Table 1):
In 2014, 93 fishing vessels (33% of the total) were involved in shipping accidents (Figure 4), down from the 109 (36%) in 2013 and down from the 2009–2013 average of 119 (38%). After fishing vessels, cargo-solid vessels (68, or 24%), tugs (22, or 8%), and service vessels (21, or 7%) were involved most often in shipping accidents in 2014.

Figure 4 data
| Type of vessel | 2005–2013 average | 2014 |
|---|---|---|
| Barge | 24 | 12 |
| Cargo - liquid | 10 | 14 |
| Cargo - solid | 71 | 68 |
| Ferry | 23 | 20 |
| Fishing | 145 | 93 |
| Passenger | 16 | 12 |
| Service ship | 31 | 21 |
| Tug | 27 | 22 |
| Other | 16 | 19 |
Geographical region (Tables 2):
In 2014, 38% of shipping accidents occurred in the Pacific region, 30% in the Central region, 29% in the Atlantic region, and the remaining 3% of shipping accidents took place in foreign waters. In the Pacific region shipping accidents were unchanged from the 2009–2013 average of 95, in the Central region shipping accidents decreased by 21% (from 94 to 74), and in the Atlantic region shipping accidents decreased by 17% (from 87 to 72).
Fishing vessels accounted for 66% of all vessels involved in shipping accidents in the Atlantic region, down 18% from the 2009-2013 average (from 64 to 53); and 33% in the Pacific region, down 11% from the 2009-2013 average (from 41 to 36).
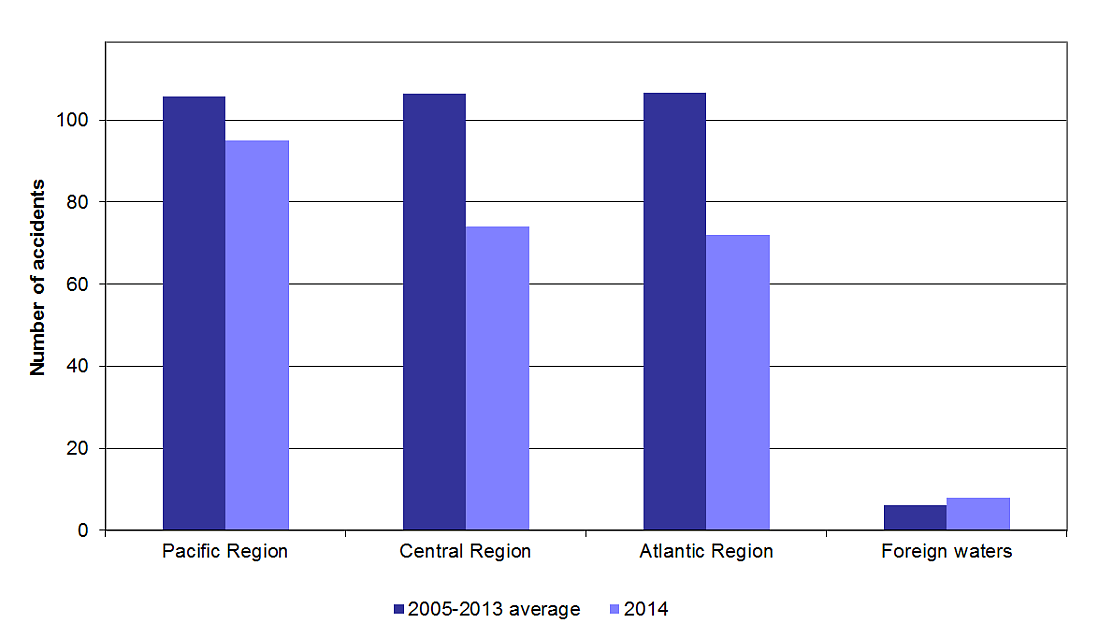
Figure 5 data
| Region | 2005–2013 average | 2014 |
|---|---|---|
| Pacific Region | 106 | 95 |
| Central Region | 106 | 74 |
| Atlantic Region | 107 | 72 |
| Foreign waters | 6 | 8 |
Vessel flag (Tables 1, 3 and 4):
In 2014, 85% of the 281 vessels involved in shipping accidents reported to the TSB were Canadian-flag vessels. In all, 45% of the Canadian-flag vessels were commercial non-fishing vessels, 39%were fishing vessels and the remaining 16% were non commercial vessels, pleasure craft or service vessels.
According to information provided by Transport Canada, marine activity for Canadian commercial non-fishing vessels of over 15 in gross tonnage (excluding passenger vessels and cruise ships) was estimated to be 29,100 commercial movements in 2014, which is a 7% increase from the 2009–2013 average of 27,176 commercial movements. This yields a rate of 3.7 commercial vessels involved in an accident per 1,000 commercial movements, down from the five-year average of 3.8 (Figure 6).
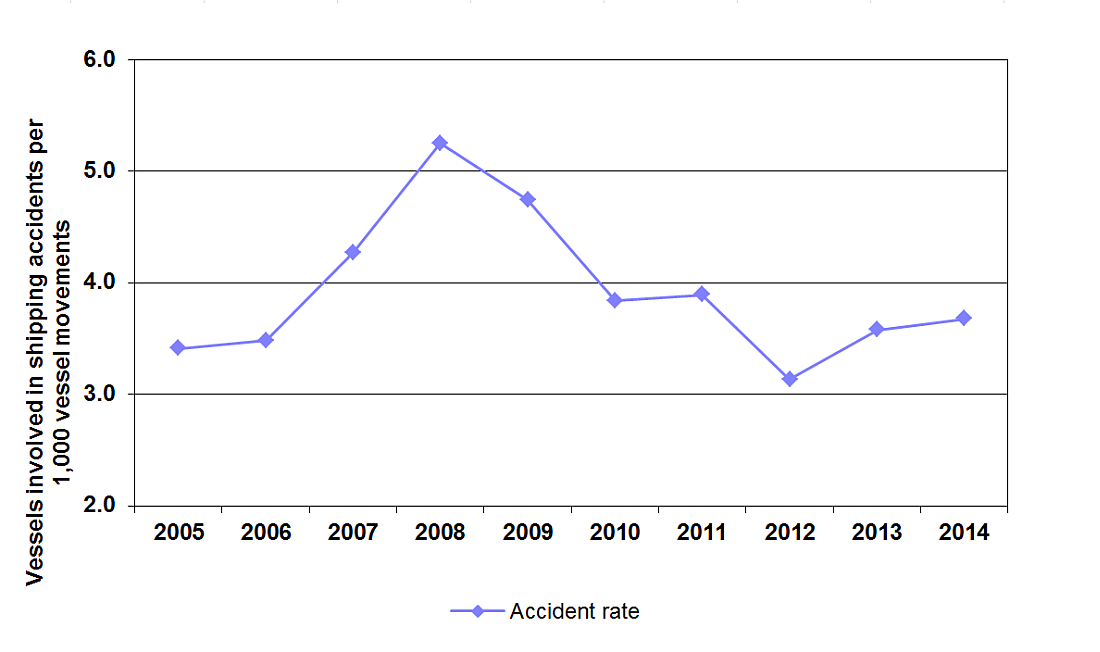
Figure 6 data
| Year | Accident rate per 1000 vessel mouvements |
|---|---|
| 2005 | 3.4 |
| 2006 | 3.5 |
| 2007 | 4.3 |
| 2008 | 5.2 |
| 2009 | 4.7 |
| 2010 | 3.8 |
| 2011 | 3.9 |
| 2012 | 3.1 |
| 2013 | 3.6 |
| 2014 | 3.7 |
In 2014, there were an estimated 13,307 active fishing vessels in CanadaFootnote 2. The shipping accident rate for Canadian fishing vessels decreased from 7.9 fishing vessels involved in shipping accidents per 1,000 active fishing vessels in 2013 to 7.0 in 2014 and decreased from the five-year average of 8.1. There has been a statistically significant downward trend in the Canadian fishing vessel shipping accident rate over the last 10 years (p<.001) (Figure 7).
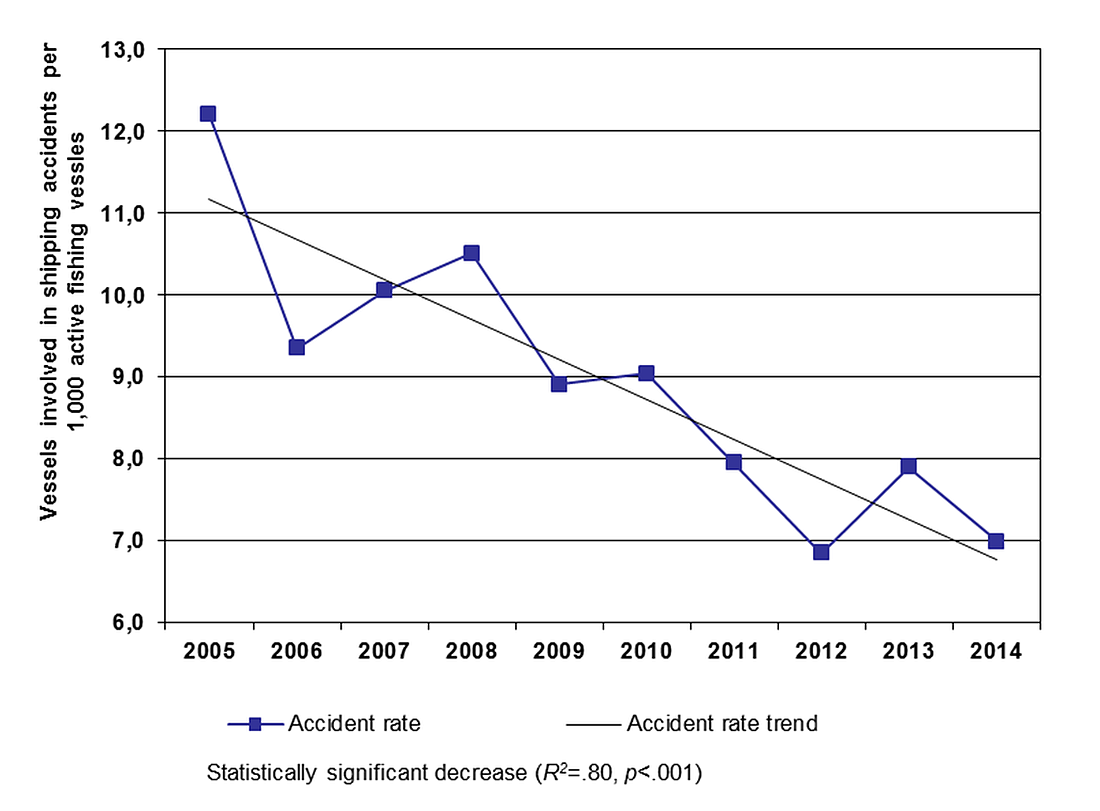
Figure 7 data
| Year | Accident rate per 1000 active fishing vessels |
|---|---|
| 2005 | 12.2 |
| 2006 | 9.3 |
| 2007 | 10.1 |
| 2008 | 10.5 |
| 2009 | 8.9 |
| 2010 | 9.0 |
| 2011 | 7.9 |
| 2012 | 6.8 |
| 2013 | 7.9 |
| 2014 | 7.0 |
For Canadian-flag fishing vessels in 2014, groundings (34%) and sinkings (20%) were the most frequent shipping accident types. Canadian-flag commercial non-fishing vessels were mostly involved in collisions (50%), or damage affecting seaworthiness or fitness for purpose (19%).
In 2014, 42 foreign-flag vessels were involved in shipping accidents in Canadian waters, 41 of which were commercial non-fishing vessels, 71% of which were involved in collisions. According to information provided by Transport Canada, marine activity for foreign commercial non-fishing vessels was 26,900 commercial movements in 2014. This represents a 5% increase from the 2009–2013 average of 25,674 commercial movements. This yields an accident rate of 1.5 commercial vessels involved in shipping accidents per 1,000 commercial movements, down from the five-year average of 1.8.
Vessels lost (Tables 1 and 5):
In 2014, 20 vessels were reported lost, down from 22 in 2013, and down from the 2009–2013 average of 24. Seventeen of the 20 vessels lost in 2014 were fishing vessels. Eight of the 20 vessels lost were less than 15 grt, and 50% were at least 20 years old. During the past 10 years, fishing vessels less than 60 grtFootnote 3 have accounted for more than half of the vessels lost in Canada.
Incidents
Overview of incidents
In 2014, 746 marine incidentsFootnote 4 were reported to the TSB, up from a total of 709 in 2013 and an annual average of 313 in 2009–2013 . On March 12, 2014, the TSB issued new regulations that changed the reporting requirements effective July 1, 2014. The new regulations clarify the reporting requirements for a total failure of any machinery or technical system, leading to an increase in this category in 2014. The significant increase in 2013 was related to the clarification of the threshold used to classify engine / rudder/propeller incident category, which is now included in the total failure of any machinery or techinical system incident category.
In 2014, incidents in the Atlantic Region represented 60% of all marine incidents followed by 20% in the Pacific Region, and 18% in the Central Region. The remaining 2% of reported incidents took place in foreign waters.
The majority of reportable incidents consisted of total failure of any machinery or technical systems (91%). The Atlantic Region had the majority of total failure of any machinery or technical systems incidents (65%) and the Pacific Region had the majority of risk of collisions (77%).
In 2014, vessels most often involved in total failure of any machinery or technical systems incidents were fishing vessels (78%) and cargo-solid vessels (7%).
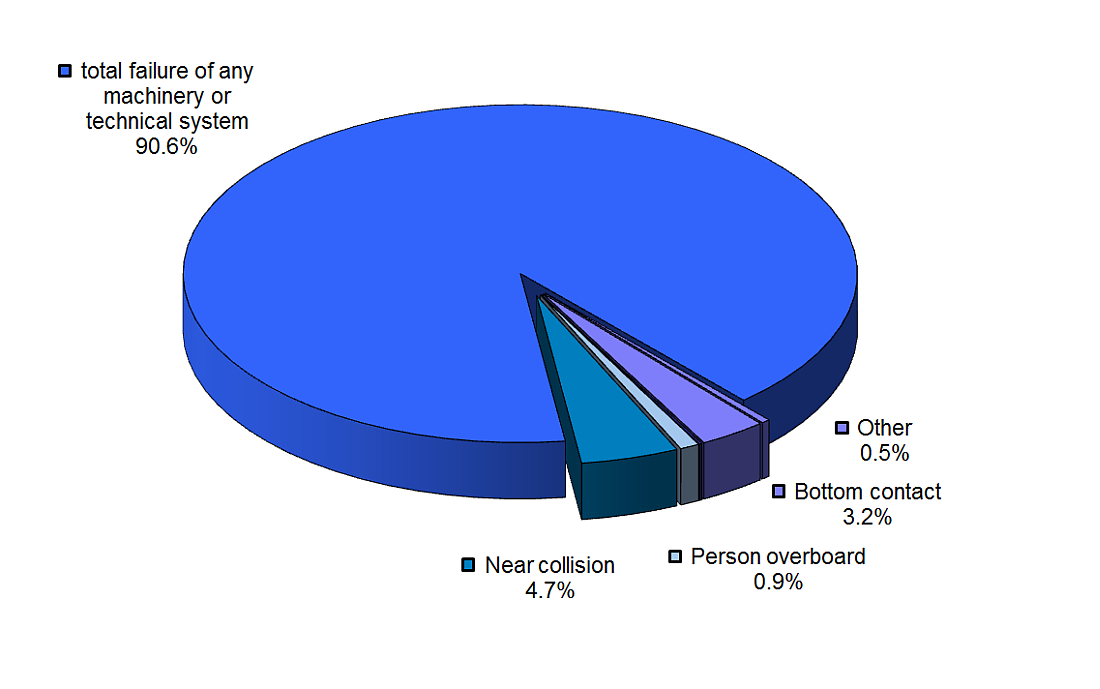
Figure 8 data
| Marine Incidents by Type | Number | Percentage |
|---|---|---|
| Bottom contact | 24 | 3.2% |
| Cargo shift/loss | 1 | 0.1% |
| Person overboard | 7 | 0.9% |
| Near collision | 35 | 4.7% |
| Total failure of any machinery or technical system | 676 | 90.6% |
| Other | 3 | 0.4% |
Appendices
Appendix A: Data tables
| 2005 | 2006 | 2007 | 2008 | 2009 | 2010 | 2011 | 2012 | 2013 | 2014 | |
|---|---|---|---|---|---|---|---|---|---|---|
| Accidents | 451 | 426 | 456 | 427 | 391 | 359 | 318 | 290 | 323 | 301 |
| Shipping accidents by type | 404 | 374 | 380 | 358 | 334 | 296 | 277 | 238 | 262 | 249 |
| Capsize | 10 | 18 | 11 | 15 | 8 | 8 | 2 | 6 | 8 | 3 |
| Collision | 110 | 94 | 84 | 95 | 81 | 65 | 87 | 77 | 79 | 88 |
| Fire/Explosion | 67 | 53 | 48 | 62 | 50 | 53 | 50 | 34 | 31 | 29 |
| Grounding | 87 | 114 | 95 | 73 | 110 | 102 | 73 | 69 | 62 | 61 |
| Sank | 78 | 69 | 69 | 74 | 54 | 41 | 33 | 33 | 38 | 26 |
| Sustains damage render unseaworthy/ Unfit for purpose |
47 | 25 | 65 | 35 | 29 | 24 | 28 | 16 | 43 | 41 |
| Other shipping accident types | 5 | 1 | 8 | 4 | 2 | 3 | 4 | 3 | 1 | 1 |
| Accidents aboard ship | 47 | 52 | 76 | 69 | 57 | 63 | 41 | 52 | 61 | 52 |
| Vessels involved in shipping accidents by type of vessel | 455 | 415 | 420 | 407 | 370 | 320 | 317 | 263 | 300 | 281 |
| Barge | 29 | 34 | 30 | 29 | 30 | 16 | 20 | 6 | 19 | 12 |
| Cargo - liquid | 15 | 14 | 8 | 6 | 11 | 12 | 10 | 6 | 7 | 14 |
| Cargo - solid | 89 | 85 | 77 | 74 | 68 | 65 | 58 | 63 | 61 | 68 |
| Ferry | 26 | 26 | 25 | 32 | 26 | 19 | 23 | 18 | 13 | 20 |
| Fishing | 208 | 163 | 172 | 167 | 138 | 130 | 117 | 99 | 109 | 93 |
| Passenger | 14 | 19 | 21 | 13 | 17 | 14 | 16 | 15 | 15 | 12 |
| Service ship | 30 | 27 | 37 | 28 | 40 | 31 | 28 | 22 | 37 | 21 |
| Tug | 26 | 25 | 38 | 37 | 20 | 19 | 24 | 28 | 26 | 22 |
| Other vessel types | 18 | 22 | 12 | 21 | 20 | 14 | 21 | 6 | 13 | 19 |
| Vessels involved in shipping accidents by vessel flag | 455 | 415 | 420 | 407 | 370 | 320 | 317 | 263 | 300 | 281 |
| Canadian non-fishing vessels | 181 | 186 | 194 | 199 | 175 | 139 | 157 | 116 | 151 | 146 |
| Canadian fishing vessels | 202 | 154 | 166 | 166 | 134 | 128 | 113 | 95 | 107 | 93 |
| Foreign vessels | 72 | 75 | 60 | 42 | 61 | 53 | 47 | 52 | 42 | 42 |
| Vessels lost by gross tonnage | 26 | 34 | 30 | 33 | 27 | 27 | 22 | 24 | 22 | 20 |
| 1600 gross tons and over | 0 | 3 | 0 | 0 | 3 | 0 | 0 | 0 | 0 | 0 |
| 150 to 1599 gross tons | 0 | 2 | 1 | 3 | 0 | 0 | 0 | 1 | 1 | 1 |
| 60 to 149 gross tons | 6 | 6 | 8 | 3 | 4 | 4 | 2 | 3 | 4 | 4 |
| 15 to 59 gross tons | 7 | 6 | 8 | 14 | 8 | 10 | 9 | 9 | 7 | 4 |
| Less than 15 gross tons | 9 | 13 | 10 | 10 | 6 | 8 | 10 | 9 | 6 | 8 |
| Unknown tonnage | 4 | 4 | 3 | 3 | 6 | 5 | 1 | 2 | 4 | 3 |
| Fatalities | 21 | 18 | 15 | 30 | 15 | 18 | 16 | 14 | 19 | 12 |
| Shipping accidents | 13 | 12 | 3 | 21 | 7 | 11 | 3 | 5 | 11 | 4 |
| Accidents aboard ship | 8 | 6 | 12 | 9 | 8 | 7 | 13 | 9 | 8 | 8 |
| Serious injuries | 46 | 56 | 67 | 61 | 56 | 78 | 36 | 48 | 50 | 46 |
| Shipping accidents | 4 | 7 | 4 | 4 | 6 | 5 | 2 | 6 | 0 | 1 |
| Accidents aboard ship | 42 | 49 | 63 | 57 | 50 | 73 | 34 | 42 | 50 | 45 |
| Occurrences with a dangerous good release* | 0 | 0 | 0 | 0 | 0 | 0 | 0 | 0 | 0 | 0 |
| Reportable incidents by type | 265 | 260 | 246 | 240 | 216 | 202 | 193 | 247 | 709 | 746 |
| Bottom contact | 28 | 21 | 24 | 23 | 14 | 13 | 14 | 21 | 19 | 24 |
| Cargo shift/Cargo loss | 4 | 4 | 2 | 6 | 6 | 3 | 2 | 5 | 2 | 1 |
| Person overboard | 4 | 10 | 15 | 9 | 7 | 9 | 4 | 5 | 10 | 7 |
| Risk of collision (near collision) | 68 | 39 | 30 | 25 | 28 | 33 | 38 | 37 | 63 | 35 |
| Total failure of any machinery or technical system** | 149 | 178 | 146 | 161 | 150 | 136 | 118 | 156 | 603 | 676 |
| Other incident types | 12 | 8 | 29 | 16 | 11 | 8 | 17 | 23 | 12 | 3 |
Data extracted May 7, 2015 In November 2013, the Transportation Safety Board developed and deployed a new Marine Database. The new database significantly improves the TSB's ability to collect, categorize and present statistics. In accordance with these changes the 2014 statistical summary onward will be presented in a slightly different format. New TSB regulations came into effect on July 1, 2014, changing some reporting requirements. * Under new reporting requirements the release of dangerous goods has been harmonized with Part 8 of the Transportation of Dangerous Goods Regulations. Detailed data was not collected prior to July 1, 2014. ** New regulations clarify the reporting requirements for a total failure of any machinery or techinical system. | ||||||||||
| 2005 | 2006 | 2007 | 2008 | 2009 | 2010 | 2011 | 2012 | 2013 | 2014 | |
|---|---|---|---|---|---|---|---|---|---|---|
| Pacific region | ||||||||||
| Shipping accidents | 122 | 126 | 110 | 119 | 113 | 92 | 92 | 81 | 97 | 95 |
| Accidents aboard ship | 14 | 15 | 21 | 14 | 22 | 15 | 11 | 18 | 22 | 23 |
| Vessels involved in shipping accidents | 145 | 146 | 124 | 142 | 127 | 101 | 108 | 91 | 121 | 108 |
| Barge/Tug | 32 | 36 | 37 | 48 | 27 | 19 | 26 | 16 | 34 | 23 |
| Cargo / Tanker | 6 | 11 | 5 | 12 | 13 | 5 | 5 | 12 | 9 | 15 |
| Ferry/Passenger | 25 | 28 | 15 | 18 | 15 | 10 | 14 | 10 | 10 | 10 |
| Fishing | 70 | 52 | 43 | 54 | 49 | 47 | 39 | 34 | 34 | 36 |
| Other vessel types | 12 | 19 | 24 | 10 | 23 | 20 | 24 | 19 | 34 | 24 |
| Vessels lost | 8 | 15 | 11 | 11 | 8 | 6 | 3 | 6 | 4 | 9 |
| Fatalities | 7 | 6 | 8 | 10 | 6 | 6 | 6 | 4 | 2 | 5 |
| Reportable incidents | 91 | 84 | 62 | 133 | 108 | 110 | 101 | 113 | 145 | 149 |
| Central region | ||||||||||
| Shipping accidents | 148 | 111 | 128 | 101 | 118 | 104 | 88 | 80 | 79 | 74 |
| Accidents aboard ship | 17 | 20 | 36 | 34 | 19 | 33 | 16 | 20 | 25 | 17 |
| Vessels involved in shipping accidents | 165 | 120 | 148 | 112 | 132 | 112 | 102 | 86 | 87 | 85 |
| Barge/Tug | 16 | 15 | 29 | 13 | 19 | 11 | 12 | 12 | 9 | 8 |
| Cargo / Tanker | 90 | 70 | 66 | 60 | 58 | 62 | 49 | 48 | 42 | 55 |
| Ferry/Passenger | 11 | 10 | 25 | 11 | 11 | 16 | 13 | 14 | 14 | 14 |
| Fishing | 24 | 12 | 14 | 10 | 20 | 11 | 14 | 7 | 12 | 3 |
| Other vessel types | 24 | 13 | 14 | 18 | 24 | 12 | 14 | 5 | 10 | 5 |
| Vessels lost | 2 | 2 | 2 | 1 | 5 | 2 | 2 | 1 | 4 | 2 |
| Fatalities | 3 | 3 | 2 | 4 | 3 | 3 | 1 | 3 | 6 | 2 |
| Reportable incidents | 108 | 100 | 117 | 77 | 74 | 66 | 70 | 106 | 145 | 137 |
| Atlantic region | ||||||||||
| Shipping accidents | 129 | 130 | 134 | 133 | 100 | 95 | 94 | 70 | 74 | 72 |
| Accidents aboard ship | 15 | 16 | 15 | 17 | 16 | 13 | 14 | 14 | 12 | 12 |
| Vessels involved in shipping accidents | 139 | 139 | 140 | 147 | 108 | 101 | 104 | 78 | 79 | 80 |
| Barge/Tug | 4 | 5 | 1 | 2 | 4 | 4 | 6 | 6 | 2 | 3 |
| Cargo / Tanker | 6 | 13 | 7 | 5 | 6 | 6 | 11 | 3 | 6 | 6 |
| Ferry/Passenger | 4 | 7 | 6 | 16 | 17 | 7 | 12 | 9 | 4 | 8 |
| Fishing | 113 | 97 | 115 | 103 | 69 | 72 | 64 | 56 | 61 | 53 |
| Other vessel types | 12 | 17 | 11 | 21 | 12 | 12 | 11 | 4 | 6 | 10 |
| Vessels lost | 15 | 17 | 17 | 21 | 13 | 18 | 17 | 16 | 13 | 9 |
| Fatalities | 11 | 9 | 5 | 14 | 6 | 8 | 9 | 6 | 11 | 5 |
| Reportable incidents | 66 | 73 | 63 | 26 | 30 | 23 | 22 | 26 | 417 | 449 |
| Foreign waters | ||||||||||
| Shipping accidents | 5 | 7 | 8 | 5 | 3 | 5 | 3 | 7 | 12 | 8 |
| Accidents aboard ship | 1 | 1 | 4 | 4 | 0 | 2 | 0 | 0 | 2 | 0 |
| Vessels involved in shipping accidents | 6 | 10 | 8 | 6 | 3 | 6 | 3 | 8 | 13 | 8 |
| Barge/Tug | 3 | 3 | 1 | 3 | 0 | 1 | 0 | 0 | 0 | 0 |
| Cargo / Tanker | 2 | 5 | 7 | 3 | 2 | 4 | 3 | 6 | 11 | 6 |
| Ferry/Passenger | 0 | 0 | 0 | 0 | 0 | 0 | 0 | 0 | 0 | 0 |
| Fishing | 1 | 2 | 0 | 0 | 0 | 0 | 0 | 2 | 2 | 1 |
| Other vessel types | 0 | 0 | 0 | 0 | 1 | 1 | 0 | 0 | 0 | 1 |
| Vessels lost | 1 | 0 | 0 | 0 | 1 | 1 | 0 | 1 | 1 | 0 |
| Fatalities | 0 | 0 | 0 | 2 | 0 | 1 | 0 | 1 | 0 | 0 |
| Reportable incidents | 0 | 3 | 4 | 4 | 4 | 3 | 0 | 2 | 2 | 11 |
Data extracted May 7, 2015 In November 2013, the Transportation Safety Board developed and deployed a new Marine Database. The new database significantly improves the TSB's ability to collect, categorize and present statistics. In accordance with these changes the 2014 statistical summary onward will be presented in a slightly different format. New TSB regulations came into effect on July 1, 2014, changing some reporting requirements. |
||||||||||
| 2005 | 2006 | 2007 | 2008 | 2009 | 2010 | 2011 | 2012 | 2013 | 2014 | |
|---|---|---|---|---|---|---|---|---|---|---|
| Canadian-flag vessels involved | 383 | 340 | 360 | 365 | 309 | 267 | 270 | 211 | 258 | 239 |
| Commercial vessels | 134 | 137 | 147 | 156 | 118 | 98 | 110 | 89 | 103 | 107 |
| Capsize | 2 | 8 | 7 | 6 | 3 | 5 | 1 | 2 | 0 | 0 |
| Collision | 64 | 55 | 59 | 61 | 41 | 35 | 56 | 43 | 46 | 53 |
| Fire/Explosion | 25 | 17 | 15 | 21 | 12 | 13 | 18 | 9 | 12 | 12 |
| Grounding | 20 | 37 | 28 | 25 | 34 | 30 | 17 | 22 | 28 | 16 |
| Sank | 13 | 16 | 15 | 29 | 18 | 5 | 3 | 4 | 4 | 6 |
| Sustains damage render unseaworthy/ Unfit for purpose |
9 | 4 | 22 | 14 | 10 | 10 | 15 | 9 | 13 | 20 |
| Other shipping accident types | 1 | 0 | 1 | 0 | 0 | 0 | 0 | 0 | 0 | 0 |
| Commercial movements (a) | 39,264 | 39,373 | 34,436 | 29,717 | 24,871 | 25,539 | 28,269 | 28,400 | 28,800 | 29,100 |
| Commercial accident rate (b) | 3.4 | 3.5 | 4.3 | 5.2 | 4.7 | 3.8 | 3.9 | 3.1 | 3.6 | 3.7 |
| Fishing vessels | 202 | 154 | 166 | 166 | 134 | 128 | 113 | 95 | 107 | 93 |
| Capsize | 5 | 7 | 3 | 5 | 3 | 1 | 1 | 3 | 6 | 1 |
| Collision | 31 | 17 | 18 | 29 | 14 | 10 | 16 | 12 | 12 | 16 |
| Fire/Explosion | 31 | 22 | 22 | 34 | 27 | 28 | 24 | 19 | 12 | 10 |
| Grounding | 55 | 49 | 48 | 37 | 56 | 51 | 43 | 33 | 30 | 32 |
| Sank | 61 | 45 | 48 | 40 | 26 | 31 | 24 | 26 | 30 | 19 |
| Sustains damage render unseaworthy/ Unfit for purpose |
16 | 13 | 20 | 17 | 7 | 4 | 1 | 0 | 16 | 14 |
| Other shipping accident types | 3 | 1 | 7 | 4 | 1 | 3 | 4 | 2 | 1 | 1 |
| Active fishing vessels (c) | 16,557 | 16,472 | 16,514 | 15,800 | 15,050 | 14,167 | 14,217 | 13,871 | 13,555 | 13,307 |
| Fishing vessel accident rate (d) | 12.2 | 9.3 | 10.1 | 10.5 | 8.9 | 9.0 | 7.9 | 6.8 | 7.9 | 7.0 |
| Other vessels | 47 | 49 | 47 | 43 | 57 | 41 | 47 | 27 | 48 | 39 |
| Capsize | 3 | 3 | 1 | 3 | 2 | 2 | 0 | 1 | 2 | 2 |
| Collision | 19 | 23 | 17 | 20 | 25 | 20 | 25 | 10 | 26 | 18 |
| Fire/Explosion | 8 | 8 | 7 | 5 | 7 | 6 | 6 | 4 | 3 | 7 |
| Grounding | 7 | 9 | 11 | 7 | 15 | 9 | 7 | 6 | 10 | 8 |
| Sank | 3 | 6 | 7 | 6 | 6 | 2 | 5 | 3 | 4 | 2 |
| Sustains damage render unseaworthy/ Unfit for purpose |
6 | 0 | 4 | 2 | 1 | 2 | 4 | 3 | 3 | 2 |
| Other shipping accident types | 1 | 0 | 0 | 0 | 1 | 0 | 0 | 0 | 0 | 0 |
Data extracted May 7, 2015
|
||||||||||
| 2005 | 2006 | 2007 | 2008 | 2009 | 2010 | 2011 | 2012 | 2013 | 2014 | |
|---|---|---|---|---|---|---|---|---|---|---|
| Foreign-flag vessels involved | 72 | 75 | 60 | 42 | 61 | 53 | 47 | 52 | 42 | 42 |
| Commercial vessels | 65 | 66 | 52 | 35 | 54 | 47 | 41 | 47 | 38 | 41 |
| Capsize | 0 | 0 | 0 | 1 | 0 | 0 | 0 | 0 | 0 | 0 |
| Collision | 38 | 30 | 19 | 22 | 26 | 18 | 23 | 28 | 19 | 29 |
| Fire/Explosion | 5 | 6 | 5 | 3 | 3 | 5 | 3 | 3 | 5 | 0 |
| Grounding | 4 | 21 | 8 | 7 | 8 | 13 | 6 | 10 | 2 | 7 |
| Sank | 2 | 1 | 1 | 0 | 3 | 3 | 1 | 1 | 1 | 0 |
| Sustains damage render unseaworthy/ Unfit for purpose |
16 | 8 | 19 | 2 | 14 | 8 | 8 | 5 | 11 | 5 |
| Other shipping accident types | 0 | 0 | 0 | 0 | 0 | 0 | 0 | 0 | 0 | 0 |
| Commercial movements (a) | 32,234 | 30,959 | 30,644 | 28,015 | 23,720 | 26,029 | 25,669 | 26,300 | 26,650 | 26,900 |
| Commercial accident rate (b) | 2.0 | 2.1 | 1.7 | 1.2 | 2.3 | 1.8 | 1.6 | 1.8 | 1.4 | 1.5 |
| Fishing vessels | 6 | 9 | 6 | 1 | 4 | 2 | 4 | 4 | 2 | 0 |
| Capsize | 0 | 1 | 0 | 0 | 0 | 0 | 0 | 0 | 0 | 0 |
| Collision | 1 | 3 | 2 | 0 | 0 | 0 | 1 | 2 | 2 | 0 |
| Fire/Explosion | 0 | 0 | 0 | 1 | 0 | 0 | 0 | 0 | 0 | 0 |
| Grounding | 3 | 4 | 4 | 0 | 3 | 2 | 3 | 1 | 0 | 0 |
| Sank | 2 | 1 | 0 | 0 | 1 | 0 | 0 | 0 | 0 | 0 |
| Sustains damage render unseaworthy/ Unfit for purpose |
0 | 0 | 0 | 0 | 0 | 0 | 0 | 0 | 0 | 0 |
| Other shipping accident types | 0 | 0 | 0 | 0 | 0 | 0 | 0 | 1 | 0 | 0 |
| Other vessels | 1 | 0 | 2 | 6 | 3 | 4 | 2 | 1 | 2 | 1 |
| Capsize | 0 | 0 | 0 | 0 | 0 | 0 | 0 | 0 | 0 | 0 |
| Collision | 0 | 0 | 1 | 5 | 2 | 3 | 2 | 1 | 2 | 1 |
| Fire/Explosion | 0 | 0 | 0 | 0 | 1 | 1 | 0 | 0 | 0 | 0 |
| Grounding | 1 | 0 | 1 | 1 | 0 | 0 | 0 | 0 | 0 | 0 |
| Sank | 0 | 0 | 0 | 0 | 0 | 0 | 0 | 0 | 0 | 0 |
| Sustains damage render unseaworthy/ Unfit for purpose |
0 | 0 | 0 | 0 | 0 | 0 | 0 | 0 | 0 | 0 |
| Other shipping accident types | 0 | 0 | 0 | 0 | 0 | 0 | 0 | 0 | 0 | 0 |
Data extracted May 7, 2015
|
||||||||||
| 2005 | 2006 | 2007 | 2008 | 2009 | 2010 | 2011 | 2012 | 2013 | 2014 | |
|---|---|---|---|---|---|---|---|---|---|---|
| All vessels | 26 | 34 | 30 | 33 | 27 | 27 | 22 | 24 | 22 | 20 |
| 0-4 years | 2 | 2 | 1 | 0 | 0 | 1 | 0 | 1 | 0 | 0 |
| 5-9 years | 1 | 4 | 1 | 5 | 2 | 5 | 1 | 1 | 1 | 0 |
| 10-14 years | 2 | 2 | 3 | 1 | 5 | 1 | 1 | 3 | 3 | 0 |
| 15-19 years | 7 | 3 | 2 | 2 | 0 | 2 | 3 | 5 | 2 | 2 |
| 20-24 years | 3 | 3 | 3 | 6 | 4 | 6 | 4 | 3 | 3 | 1 |
| 25-29 years | 4 | 1 | 4 | 3 | 2 | 2 | 4 | 3 | 2 | 5 |
| 30+ years | 3 | 13 | 10 | 9 | 7 | 4 | 7 | 5 | 5 | 4 |
| Unknown | 4 | 6 | 6 | 7 | 7 | 6 | 2 | 3 | 6 | 8 |
| Commercial vessels | 2 | 8 | 6 | 5 | 8 | 1 | 1 | 1 | 1 | 2 |
| 0-4 years | 0 | 0 | 0 | 0 | 0 | 0 | 0 | 0 | 0 | 0 |
| 5-9 years | 0 | 0 | 0 | 0 | 0 | 0 | 0 | 0 | 0 | 0 |
| 10-14 years | 0 | 0 | 0 | 0 | 1 | 0 | 0 | 0 | 0 | 0 |
| 15-19 years | 0 | 0 | 0 | 0 | 0 | 0 | 0 | 0 | 0 | 0 |
| 20-24 years | 0 | 0 | 0 | 0 | 0 | 0 | 0 | 0 | 0 | 0 |
| 25-29 years | 0 | 0 | 0 | 2 | 0 | 0 | 0 | 0 | 0 | 1 |
| 30+ years | 1 | 6 | 5 | 3 | 3 | 0 | 1 | 1 | 1 | 1 |
| Unknown | 1 | 2 | 1 | 0 | 4 | 1 | 0 | 0 | 0 | 0 |
| Fishing vessels | 24 | 24 | 21 | 25 | 16 | 23 | 21 | 23 | 19 | 17 |
| 0-4 years | 2 | 2 | 1 | 0 | 0 | 1 | 0 | 1 | 0 | 0 |
| 5-9 years | 1 | 4 | 1 | 5 | 2 | 5 | 1 | 1 | 1 | 0 |
| 10-14 years | 2 | 2 | 3 | 1 | 4 | 1 | 1 | 3 | 3 | 0 |
| 15-19 years | 7 | 3 | 2 | 2 | 0 | 2 | 3 | 5 | 2 | 2 |
| 20-24 years | 3 | 3 | 3 | 4 | 4 | 6 | 4 | 3 | 3 | 1 |
| 25-29 years | 4 | 1 | 4 | 1 | 2 | 1 | 4 | 3 | 2 | 4 |
| 30+ years | 2 | 6 | 4 | 6 | 4 | 4 | 6 | 4 | 2 | 3 |
| Unknown | 3 | 3 | 3 | 6 | 0 | 3 | 2 | 3 | 6 | 7 |
| Other vessels | 0 | 2 | 3 | 3 | 3 | 3 | 0 | 0 | 2 | 1 |
| 0-4 years | 0 | 0 | 0 | 0 | 0 | 0 | 0 | 0 | 0 | 0 |
| 5-9 years | 0 | 0 | 0 | 0 | 0 | 0 | 0 | 0 | 0 | 0 |
| 10-14 years | 0 | 0 | 0 | 0 | 0 | 0 | 0 | 0 | 0 | 0 |
| 15-19 years | 0 | 0 | 0 | 0 | 0 | 0 | 0 | 0 | 0 | 0 |
| 20-24 years | 0 | 0 | 0 | 2 | 0 | 0 | 0 | 0 | 0 | 0 |
| 25-29 years | 0 | 0 | 0 | 0 | 0 | 1 | 0 | 0 | 0 | 0 |
| 30+ years | 0 | 1 | 1 | 0 | 0 | 0 | 0 | 0 | 2 | 0 |
| Unknown | 0 | 1 | 2 | 1 | 3 | 2 | 0 | 0 | 0 | 1 |
Data extracted May 7, 2015 | ||||||||||
| 2005 | 2006 | 2007 | 2008 | 2009 | 2010 | 2011 | 2012 | 2013 | 2014 | |
|---|---|---|---|---|---|---|---|---|---|---|
| Shipping accidents with fatalities or serious injuries | 9 | 14 | 4 | 14 | 10 | 7 | 4 | 7 | 5 | 4 |
| Capsize | 6 | 6 | 2 | 8 | 1 | 1 | 0 | 3 | 2 | 0 |
| Collision | 1 | 1 | 1 | 0 | 4 | 3 | 1 | 1 | 0 | 1 |
| Fire/Explosion | 1 | 4 | 0 | 1 | 0 | 0 | 2 | 3 | 1 | 0 |
| Grounding | 0 | 2 | 0 | 1 | 1 | 0 | 1 | 0 | 1 | 0 |
| Sank | 1 | 1 | 1 | 4 | 4 | 1 | 0 | 0 | 1 | 3 |
| Sustains damage render unseaworthy/ Unfit for purpose |
0 | 0 | 0 | 0 | 0 | 0 | 0 | 0 | 0 | 0 |
| Other shipping accident types | 0 | 0 | 0 | 0 | 0 | 2 | 0 | 0 | 0 | 0 |
| Shipping accidents fatalities (a) | 13 | 12 | 3 | 21 | 7 | 11 | 3 | 5 | 11 | 4 |
| Capsize | 10 | 6 | 2 | 15 | 2 | 4 | 0 | 3 | 6 | 0 |
| Collision | 0 | 0 | 1 | 0 | 0 | 0 | 1 | 1 | 0 | 0 |
| Fire/Explosion | 0 | 2 | 0 | 0 | 0 | 0 | 1 | 1 | 1 | 0 |
| Grounding | 0 | 3 | 0 | 0 | 1 | 0 | 1 | 0 | 3 | 0 |
| Sank | 3 | 1 | 0 | 6 | 4 | 1 | 0 | 0 | 1 | 4 |
| Sustains damage render unseaworthy/ Unfit for purpose |
0 | 0 | 0 | 0 | 0 | 0 | 0 | 0 | 0 | 0 |
| Other shipping accident types | 0 | 0 | 0 | 0 | 0 | 6 | 0 | 0 | 0 | 0 |
| Shipping accidents serious injuries | 4 | 7 | 4 | 4 | 6 | 5 | 2 | 6 | 0 | 1 |
| Capsize | 1 | 1 | 0 | 0 | 0 | 0 | 0 | 3 | 0 | 0 |
| Collision | 2 | 1 | 2 | 0 | 5 | 5 | 1 | 0 | 0 | 1 |
| Fire/Explosion | 1 | 5 | 0 | 2 | 0 | 0 | 1 | 3 | 0 | 0 |
| Grounding | 0 | 0 | 0 | 2 | 0 | 0 | 0 | 0 | 0 | 0 |
| Sank | 0 | 0 | 2 | 0 | 1 | 0 | 0 | 0 | 0 | 0 |
| Sustains damage render unseaworthy/ Unfit for purpose |
0 | 0 | 0 | 0 | 0 | 0 | 0 | 0 | 0 | 0 |
| Other shipping accident types | 0 | 0 | 0 | 0 | 0 | 0 | 0 | 0 | 0 | 0 |
| Accidents aboard ship | 47 | 52 | 76 | 69 | 57 | 63 | 41 | 52 | 61 | 52 |
| Accidents aboard ship fatalities (a) | 8 | 6 | 12 | 9 | 8 | 7 | 13 | 9 | 8 | 8 |
| Boarding, being on board, falling overboard from the ship | 4 | 5 | 7 | 3 | 6 | 4 | 13 | 3 | 3 | 5 |
| In contact with any part of the ship or its contents | 4 | 1 | 5 | 6 | 2 | 3 | 0 | 6 | 5 | 3 |
| Accidents aboard ship serious injuries | 42 | 49 | 63 | 57 | 50 | 73 | 34 | 42 | 50 | 45 |
| Boarding, being on board, falling overboard from the ship | 5 | 2 | 6 | 5 | 3 | 2 | 3 | 2 | 7 | 10 |
| In contact with any part of the ship or its contents | 37 | 47 | 57 | 52 | 47 | 71 | 31 | 40 | 43 | 35 |
Data extracted May 7, 2015
|
||||||||||
| 2005 | 2006 | 2007 | 2008 | 2009 | 2010 | 2011 | 2012 | 2013 | 2014 | |
|---|---|---|---|---|---|---|---|---|---|---|
| Vessels involved in shipping accidents with fatalities or serious injuries | 9 | 14 | 4 | 14 | 10 | 7 | 4 | 7 | 5 | 4 |
| Barge/Tug | 0 | 0 | 1 | 1 | 0 | 0 | 0 | 2 | 0 | 0 |
| Cargo | 0 | 2 | 0 | 3 | 0 | 0 | 0 | 0 | 0 | 1 |
| Ferry/Passenger | 0 | 2 | 0 | 1 | 1 | 1 | 0 | 0 | 0 | 0 |
| Fishing | 6 | 9 | 1 | 6 | 6 | 4 | 3 | 4 | 5 | 3 |
| Other | 3 | 1 | 2 | 3 | 3 | 2 | 1 | 1 | 0 | 0 |
| Shipping accident fatalities (a) | 13 | 12 | 3 | 21 | 7 | 11 | 3 | 5 | 11 | 4 |
| Barge/Tug | 0 | 0 | 1 | 0 | 0 | 0 | 0 | 1 | 0 | 0 |
| Cargo | 0 | 1 | 0 | 7 | 0 | 0 | 0 | 0 | 0 | 2 |
| Ferry/Passenger | 0 | 2 | 0 | 0 | 0 | 4 | 0 | 0 | 0 | 0 |
| Fishing | 11 | 8 | 1 | 10 | 7 | 7 | 2 | 2 | 11 | 2 |
| Other | 2 | 1 | 1 | 4 | 0 | 0 | 1 | 2 | 0 | 0 |
| Shipping accident serious injuries | 4 | 7 | 3 | 4 | 6 | 5 | 2 | 6 | 0 | 1 |
| Barge/Tug | 0 | 0 | 0 | 2 | 0 | 0 | 0 | 1 | 0 | 0 |
| Cargo | 0 | 2 | 0 | 0 | 0 | 0 | 0 | 0 | 0 | 0 |
| Ferry/Passenger | 0 | 1 | 0 | 2 | 1 | 0 | 0 | 0 | 0 | 0 |
| Fishing | 2 | 4 | 0 | 0 | 1 | 1 | 1 | 3 | 0 | 1 |
| Other | 2 | 0 | 3 | 0 | 4 | 4 | 1 | 2 | 0 | 0 |
| Vessels involved in accidents aboard ship | 48 | 53 | 77 | 71 | 58 | 64 | 41 | 53 | 61 | 52 |
| Barge/Tug | 6 | 4 | 8 | 9 | 6 | 5 | 4 | 1 | 3 | 4 |
| Cargo | 9 | 19 | 25 | 22 | 16 | 22 | 13 | 23 | 17 | 21 |
| Ferry/Passenger | 7 | 3 | 8 | 8 | 7 | 8 | 6 | 3 | 7 | 5 |
| Fishing | 16 | 22 | 24 | 17 | 20 | 17 | 17 | 21 | 25 | 18 |
| Other | 10 | 5 | 12 | 15 | 9 | 12 | 1 | 5 | 9 | 4 |
| Accident aboard ship fatalities (a) | 8 | 6 | 12 | 9 | 8 | 7 | 13 | 9 | 8 | 8 |
| Barge/Tug | 0 | 1 | 1 | 1 | 1 | 0 | 1 | 0 | 1 | 0 |
| Cargo | 1 | 3 | 2 | 3 | 0 | 1 | 1 | 2 | 2 | 1 |
| Ferry/Passenger | 2 | 0 | 0 | 0 | 1 | 2 | 1 | 1 | 0 | 0 |
| Fishing | 4 | 2 | 6 | 4 | 4 | 4 | 10 | 6 | 5 | 6 |
| Other | 1 | 0 | 3 | 1 | 2 | 0 | 0 | 0 | 0 | 1 |
| Accident aboard ship serious injuries | 40 | 48 | 60 | 56 | 49 | 70 | 30 | 42 | 49 | 42 |
| Barge/Tug | 5 | 3 | 7 | 6 | 4 | 5 | 3 | 0 | 2 | 4 |
| Cargo | 8 | 16 | 18 | 18 | 16 | 36 | 12 | 21 | 12 | 18 |
| Ferry/Passenger | 6 | 4 | 7 | 8 | 5 | 5 | 6 | 2 | 7 | 5 |
| Fishing | 11 | 20 | 18 | 12 | 16 | 13 | 8 | 15 | 19 | 12 |
| Other | 10 | 5 | 10 | 12 | 8 | 11 | 1 | 4 | 9 | 3 |
Data extracted May 7, 2015
|
||||||||||
Appendix B: Definitions (based on TSB act and regulations)
The following definitions apply to marine occurrences that are required to be reported pursuant to the Canadian Transportation Accident Investigation and Safety Board Act and the TSB regulations.
Marine occurrence
- any accident or incident associated with the operation of a ship and
- any situation or condition that the Board has reasonable grounds to believe could, if left unattended, induce an accident or incident described above.
Marine accident
An accident resulting directly from the operation of a ship other than a pleasure craft, where
Accident aboard ship
- a person is killed or sustains a serious injury as a result of
- boarding, being on board or falling overboard from the ship, or
- coming into direct contact with any part of the ship or its contents;
Shipping accident
- the ship
- sinks, founders or capsizes,
- is involved in a collision (includes strikings and contacts)
- sustains a fire or an explosion,
- goes aground,
- sustains damage that affects its seaworthiness or renders it unfit for its purpose,
- is missing or abandoned
Marine incident
- a person falls overboard from the ship;
- makes unforeseen contact with the bottom without going aground,
- fouls a utility cable or pipe, or an underwater pipeline,
- is involved in a risk of a collision,
- sustains a total failure of
- the navigation equipment if the failure poses a threat to the safety of any person, property or the environment,
- the main or auxiliary machinery, or
- the propulsion, steering, or deck machinery if the failure poses a threat to the safety of any person, property or the environment;
- all or part of the ship's cargo shifts or falls overboard; or
- is anchored, grounded or beached to avoid an occurrence,
- a crew member whose duties are directly related to the safe operation of the ship is unable to perform their duties as a result of a physical incapacitation which poses a threat to the safety of persons, property or the environment;
- there is an accidental release on board or from the ship consisting of a quantity of dangerous goods or an emission of radiation that is greater than the quantity or emission levels specified in Part 8 of the Transportation of Dangerous Goods Regulations.
Serious injury
- a fracture of any bone, except simple fractures of fingers, toes or the nose;
- lacerations that cause severe hemorrhage or nerve, muscle or tendon damage;
- an injury to an internal organ;
- second or third degree burns, or any burns affecting more than 5% of the body surface;
- a verified exposure to infectious substances or injurious radiation; or
- an injury that is likely to require hospitalization.
Vessels covered
This report covers commercial vessels that include all vessels either registered or licensed to operate commercially. Pleasure craft occurrences are not normally included unless they also involved a commercial vessel.
Vessel categories
Commercial Vessels: include cargo vessels, ferries, passenger vessels, tugs and barges.
Fishing Vessels: include vessels involved in commercial fishing.
Other Vessels: include research vessels, oil exploration, exploitation and support vessels, government vessels and pleasure craft.
Miscellaneous
Gross tons (grt): A measure of vessel capacity in cubic feet of the spaces within the hull, and of enclosed spaces above deck available for cargo, stores, fuel, passengers and crew, with certain exclusions. One hundred cubic feet is equivalent to one gross ton.
Movement: A vessel's travel segment between ports with at least one port being a domestic port.
Appendix C — Regional Limits
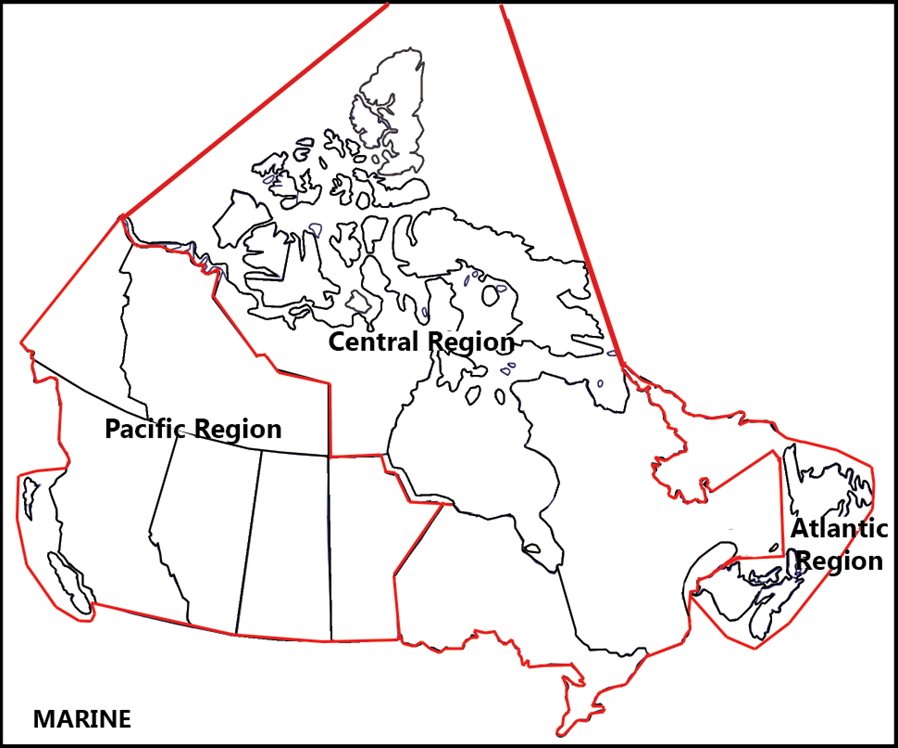
Pacific Region’s area of responsibility consists of the provinces of British Columbia, Alberta, Saskatchewan, and Manitoba, the Yukon and the Northwest Territories south of the 70th parallel, as well as the waters adjacent to these provinces and territories.
Central Region’s area of responsibility consists of the provinces of Ontario and Quebec (including the Magdalen Islands), the territory of Nunavut, and the Northwest Territories north of the 70th parallel, as well as James Bay, Hudson Bay, the St. Lawrence Seaway, and the Great Lakes waterways up to the Canada-US border.
Atlantic Region’s area of responsibility consists of the provinces of New Brunswick, Nova Scotia, Prince Edward Island, and Newfoundland and Labrador, as well as the waters adjacent to these provinces.