
Executive summary
The TSB received 60 reports of pipeline transportation occurrences in 2025, all of which were incidents—there were no accidents. There were no fatalities arising directly from the operation of any federally regulated pipeline, as has been the case since the TSB’s inception in 1990.
The number of reported incidents in 2025 (60) is fewer than in 2024 (64) and 32% below the average of 89 for the previous 10 years. The lack of any pipeline accident in 2025 betters the average number of accidents in the prior 10 years (1).
Of the 60 incidents in 2025, 20 involved a release of product, which is 33% of the total, a little below the 10-year average of 36%.
An occurrence rate of 0.9 occurrences per 1000 km of operating pipeline was calculated for 2025 based on the 60 occurrences reported and the 69 000 km of federally regulated pipelines that were operational in Canada according to the Canada Energy Regulator (CER) during the same year. This occurrence rate is below that reported in 2024 (1.0), and below the average of 1.3 in the 10-year period from 2015 to 2024.
Pipeline transportation occurrences in 2025
This document covers federally regulated pipelines only. Any non-federally regulated pipeline data reported to the Transportation Safety Board of Canada (TSB) are not included in this report.
The TSB gathers and uses transportation occurrence data (for both accidents and incidents)See Definitions section. during the course of its investigations to analyze safety deficiencies and identify risks in the Canadian pipeline transportation system.
This statistical summary serves to describe the accident, incident, and injury counts that are presented in the included tables. It provides limited discussion and some context but is not intended to be an in-depth analysis of the data. Averages and percentages in this summary have been rounded (up or down to the nearest whole number).
It should be noted that certain characteristics of the data constrain statistical analysis and the identification of emerging trends. These include the small totals of accidents and incidents, the large variability in the data from year to year, and changes to regulations and definitions. The reader is cautioned to keep these limitations in mind when reading this summary to avoid drawing conclusions that cannot be supported by statistical analysis.
The 2025 data were collected according to the reporting requirements described in the Transportation Safety Board Regulations in force during that calendar year.On 12 December 2018, amendments to the Transportation Safety Board Regulations were published in the Canada Gazette, Part II. The amendments were made to reorganize and update some of the pipeline occurrence reporting provisions to ensure consistency and clarity. In addition, minor discrepancies between the English and French texts were addressed.
The statistics presented here reflect the TSB Pipeline Occurrence Database System (PODS) on 24 February 2026. Since the occurrence data are constantly being updated in the live database as additional information becomes available, the statistics may change slightly over time.
Also, as many occurrences are limited to data gathering, information recorded on some occurrences may not have been verified.
The pipeline system
In the federally regulated pipeline system in 2025, 100 companies transported either oil or gas, or both, through approximately 21 000 km of oil pipelines and approximately 47 900 km of gas pipelines.The size of the federally regulated pipeline system, the number of companies, and the volumes of product transported were provided by the Canada Energy Regulator (CER) by email communication on 13 April 2026. Until 2019, the CER was known as the National Energy Board, and the TSB Regulations still refer to the agency by its former name. A further 100 km of pipelines carried other commodities and substances. Altogether, this represents approximately 20.1 exajoules (EJ) of energy content transported.
Pipeline transportation occurrences
In 2025, 60 pipeline transportation occurrences were reported to the TSB (Table 1 and Figure 1); all of these occurrences were classified as incidents.See the Definitions section. This total is lower than the 65 to 68 occurrences recorded each year from 2022 to 2024, and well below the average of 90 occurrences per year over the 10-year period 2015-2024. In fact, 2025 saw the second lowest number of pipeline occurrences ever recorded by the TSB, with 2019 showing the only lower total (52 occurrences). Fluctuations to the reported numbers over this period may have resulted from various factors, including changes to regulations and definitions. Although an average of 1 accident was reported each year from 2015 to 2024, no accidents were reported in 2025.
In 2025, there were no serious injuries or fatalities arising directly from the operation of a federally regulated pipeline, as has been the case each year since 2017. Indeed, there have been no fatal accidents on a federally regulated pipeline system directly resulting from the operation of a pipeline since the inception of the TSB in 1990.
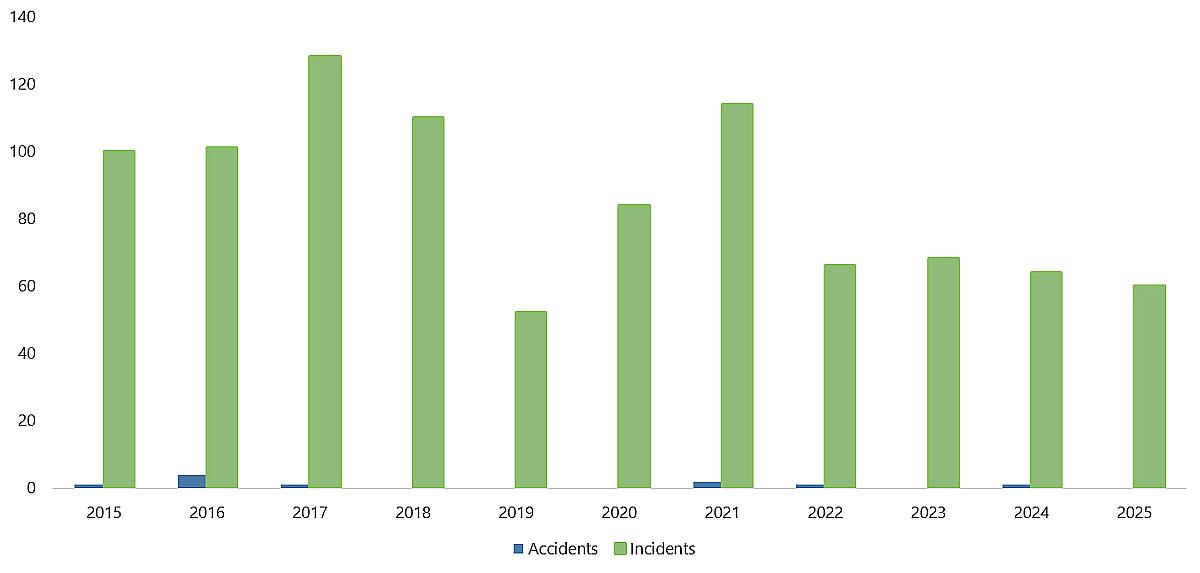
Figure 1. Data table
| Year | Number of accidents | Number of incidents |
|---|---|---|
| 2015 | 1 | 100 |
| 2016 | 4 | 101 |
| 2017 | 1 | 128 |
| 2018 | 0 | 110 |
| 2019 | 0 | 52 |
| 2020 | 0 | 84 |
| 2021 | 2 | 114 |
| 2022 | 1 | 66 |
| 2023 | 0 | 68 |
| 2024 | 1 | 64 |
| 2025 | 0 | 60 |
Release of product
Of the 60 reported occurrences in 2025, 20 involved a release of product (Table 5). Four of these were releases from line pipe body. This total of 20 occurrences with product release was above the 12 reported to the TSB in 2024, below the recent peak of 25 reported in 2022, and also well below the average number (33) of such occurrences between 2015 and 2024. Figure 2 shows the products released in these occurrences. In 18 occurrences, hydrocarbon gas was released: consisting of natural gas (rather than sour gas) in each case. Low vapour pressure (LVP) hydrocarbons were released in 2 occurrences: these were crude oil and refined products. In 2025, 52 occurrences did not involve a release of product; this was less than the average number of occurrences without release over the previous 10 years (56).
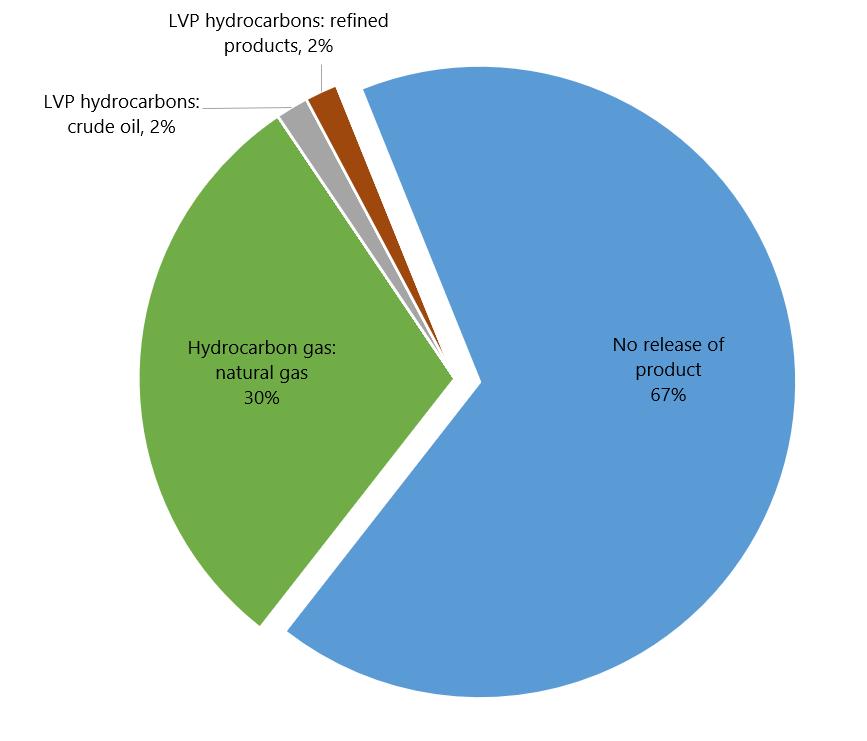
Figure 2. Data table
| Gas - sour or acid | 0 |
|---|---|
| Hydrocarbon gas: natural gas | 18 |
| Natural gas liquids / liquefied petroleum gas | 0 |
| LVP hydrocarbons: condensate | 0 |
| LVP hydrocarbons: condensate - sour | 0 |
| LVP hydrocarbons: crude oil | 1 |
| LVP hydrocarbons: crude oil - sour | 0 |
| LVP hydrocarbons: refined products | 1 |
| Other products: gas | 0 |
| Other products: liquid | 0 |
Events other than product release
In 2025, 17 occurrences (all of them incidents) involved “geotechnical, hydrotechnical or environmental activity,” for example, slope movements or river erosion that exposed a length of pipe (Table 1 and Figure 3). This was less than the 22 such incidents reported in 2024 and also below the average of 22 such incidents reported per year between 2015 and 2024.
There were 12 incidents of pipelines being contacted by an object in 2025. This was only slightly higher than the number reported in 2024 (11), and the average number of such incidents per year during the previous 10 years (also 11). “Operation beyond limits” was reported in only 2 occurrences, well below the number of such occurrences reported the previous year (9), and the average of 13 occurrences of this type per year, between 2015 and 2024.
In 2025, 3 occurrences were reported involving fire, all of which were incidents. The total number of occurrences involving fire was equal to the lowest number ever recorded (3 in 2019). Meanwhile, the number of incidents where “unauthorized third-party activity affects pipeline structural integrity” decreased to 2, below the number reported in 2024 (3) and the average over the previous 10 years (4). Three occurrences in 2025 involved an explosion (all incidents); this was equal to the number of occurrences involving explosions in 2024 but higher than the average over the previous 10 years (2).
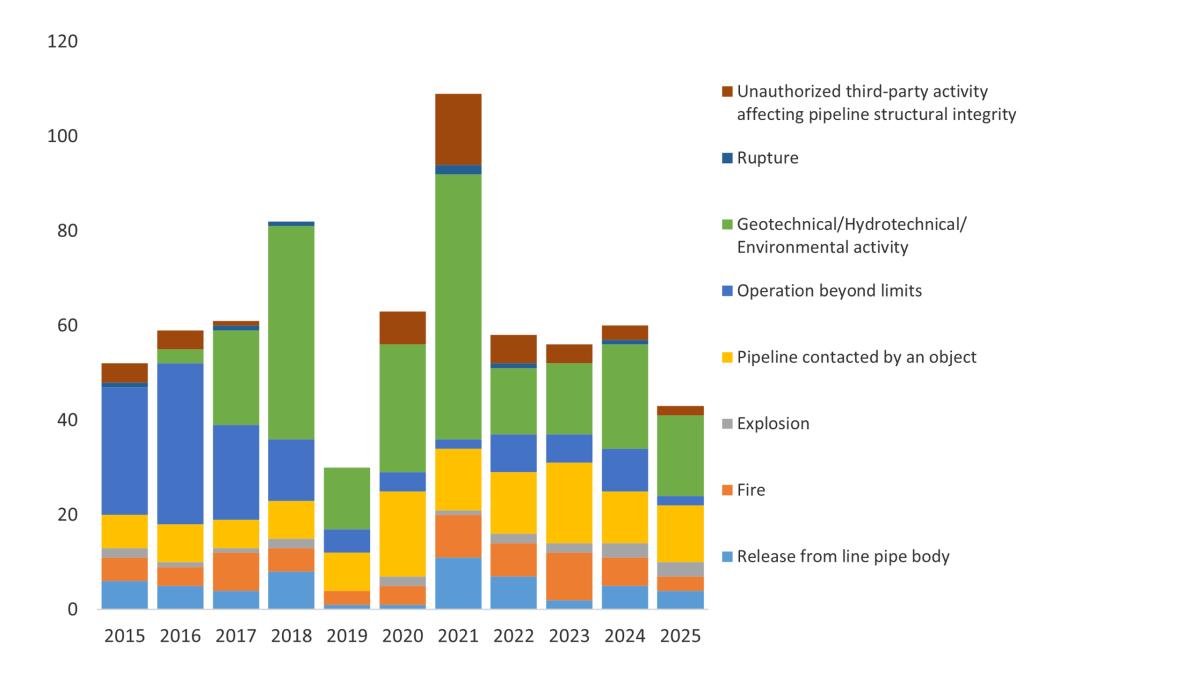
Note: The figure includes all types of events for pipeline transportation occurrences reported to the TSB under the Transportation Safety Board Regulations, aside from those solely categorized as “product released.” Product release is defined as an occurrence "resulting directly from the operation of a pipeline where an unintended or uncontrolled release of commodity resulted in a significant adverse effect on people or the environment." Some occurrences may be coded to multiple event types.
Figure 3. Data table
| Year | Release from line pipe body | Fire | Explosion | Pipeline contacted by an object | Operation beyond limits | Geotechnical/Hydrotechnica l/Environmental activity | Rupture | Unauthorized 3rd-party activity affecting pipeline structural integrity |
|---|---|---|---|---|---|---|---|---|
| 2015 | 6 | 5 | 2 | 7 | 27 | 0 | 1 | 4 |
| 2016 | 5 | 4 | 1 | 8 | 34 | 3 | 0 | 4 |
| 2017 | 4 | 8 | 1 | 6 | 20 | 20 | 1 | 1 |
| 2018 | 8 | 5 | 2 | 8 | 13 | 45 | 1 | 0 |
| 2019 | 1 | 3 | 0 | 8 | 5 | 13 | 0 | 0 |
| 2020 | 1 | 4 | 2 | 18 | 4 | 27 | 0 | 7 |
| 2021 | 11 | 9 | 1 | 13 | 2 | 56 | 2 | 15 |
| 2022 | 7 | 7 | 2 | 13 | 8 | 14 | 1 | 6 |
| 2023 | 2 | 10 | 2 | 17 | 6 | 15 | 0 | 4 |
| 2024 | 5 | 6 | 3 | 11 | 9 | 22 | 1 | 3 |
| 2025 | 4 | 3 | 3 | 12 | 2 | 17 | 0 | 2 |
Geography
The largest number of occurrences in 2025 (22 out of 60) took place in Alberta (Table 2); this is below the number reported in 2024 (31) and also below the average between 2015 and 2024 (30). Decreases year over year were also reported in Ontario (from 12 to 9 occurrences, year over year) and in New Brunswick (from 3 to 0 occurrences). Manitoba had the largest increase in occurrences, from 0 in 2024 to 4 in 2025. Between 2024 and 2025, British Columbia increased from 8 to 10 occurrences, Quebec increased from 7 to 9 occurrences, Saskatchewan increased from 2 to 4 occurrences, and the Northwest Territories increased from 1 occurrence in 2024 to 2 occurrences in 2025.
Facilities
As in 2024, a majority of occurrences in 2025 (62%; 37 of 60) occurred at locations along a pipeline, while 38% (23 of 60) occurred at facilities (Figure 4). Similarly, across the 10-year period from 2015 to 2024, 520 occurrences (59%) took place at locations along a pipeline while 366 occurrences(41%) were at facilities (Table 3). Of the 23 occurrences at facilities in 2025 (all of them incidents), 15 occurred at compressor stations, 3 at terminals, 3 at pump stations, 1 at a meter station, and 1 at another facility.
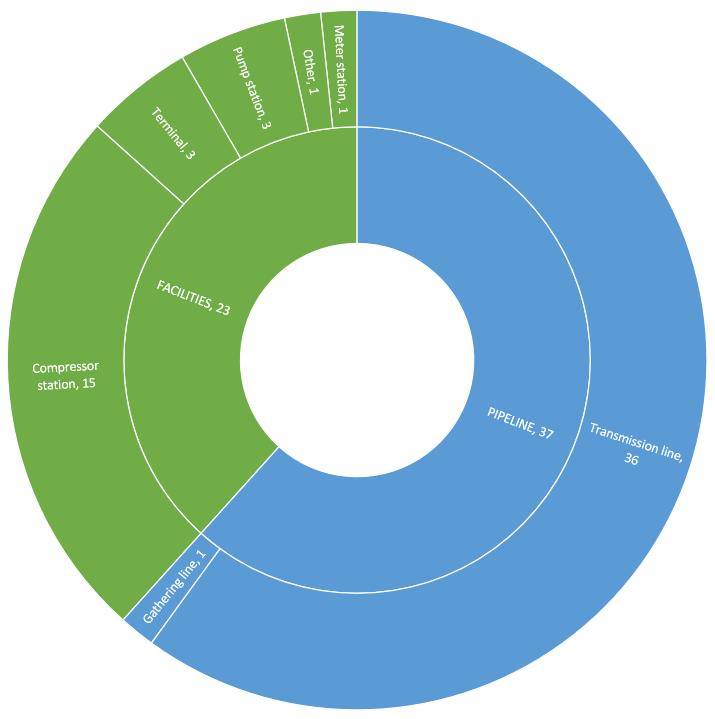
Figure 4. Data table
| Occurrences | Accidents | Incidents | ||
|---|---|---|---|---|
| FACILITIES, 23 | Compressor station | 15 | 0 | 15 |
| Gas processing plant | 0 | 0 | 0 | |
| Meter station | 1 | 0 | 1 | |
| Pump station | 3 | 0 | 3 | |
| Storage facility | 0 | 0 | 0 | |
| Terminal | 3 | 0 | 3 | |
| Receipt / Delivery facility | 0 | 0 | 0 | |
| Other | 1 | 0 | 1 | |
| PIPELINE, 37 | Gathering line | 1 | 0 | 1 |
| Transmission line | 36 | 0 | 36 |
Pipeline occurrence rate
An occurrence rate of 0.9 occurrences per 1000 km of operating pipeline was calculated for 2025, based on the 60 occurrences reported and the 69 000 km of federally regulated pipelines that were operational in Canada according to the Canada Energy Regulator (CER) during the same year (Table 4 and Figure 5). This occurrence rate is below that reported in 2024 (1.0), and below the average of 1.3 in the 10-year period from 2015 to 2024.
To test whether this occurrence rate shows a statistically significant trend, Kendall’s tau-b (τb) correlation and Sen’s estimate of slope were used. Kendall's τb correlation coefficient is a nonparametric measure of the strength and direction of association that exists between 2 variables. Kendall’s τb was calculated on the 11-year series of accident rate values by year from 2015 to 2025. There was a marginally significant, moderate negative correlation, indicating a downward trend in occurrence rate over the period (τb = −0.4546, p = 0.052). Sen’s estimate of slope, the amount of downward rate change per year, was −0.061 occurrences per 1000 km of operating pipeline per year.
An occurrence rate can also be calculated using exajoules (EJ) of energy as a denominator (Table 4 and Figure 5). In 2025, the equivalent of 20.1 EJ of energy were transported in federally regulated pipelines. The 60 occurrences in 2025 translate to a rate of 3.0 occurrences per EJ, a figure slightly lower than the 2024 rate of 3.4 and well below the 2015 to 2024 average of 5.2 occurrences per EJ. This downward trend in occurrence rate per EJ is also statistically significant (τb = −0.5636, p = 0.016). Sen’s estimate of slope, the amount of downward rate change per year, was −0.370 occurrences per EJ per year.

Figure 5. Data table
| Year | Number of occurrences | Occurrences per EJ | Sen's estimate of slope (–0.370) | Occurrences per 1000 km of pipeline | Sen's estimate of slope (–0.061) |
|---|---|---|---|---|---|
| 2015 | 101 | 6.4 | 6.7 | 1.4 | 1.5 |
| 2016 | 101 | 6.3 | 6.3 | 1.4 | 1.4 |
| 2017 | 132 | 7.9 | 5.9 | 1.9 | 1.4 |
| 2018 | 111 | 6.3 | 5.6 | 1.6 | 1.3 |
| 2019 | 52 | 3.0 | 5.2 | 0.7 | 1.2 |
| 2020 | 84 | 5.1 | 4.8 | 1.2 | 1.2 |
| 2021 | 116 | 6.6 | 4.5 | 1.7 | 1.1 |
| 2022 | 67 | 3.6 | 4.1 | 1.0 | 1.1 |
| 2023 | 68 | 3.6 | 3.7 | 1.0 | 1.0 |
| 2024 | 65 | 3.4 | 3.4 | 1.0 | 0.9 |
| 2025 | 60 | 3.0 | 3.0 | 0.9 | 0.9 |
Data tables
| 2015 | 2016 | 2017 | 2018 | 2019 | 2020 | 2021 | 2022 | 2023 | 2024 | 2025 | |
|---|---|---|---|---|---|---|---|---|---|---|---|
| Occurrences | 101 | 101 | 132 | 111 | 52 | 84 | 116 | 67 | 68 | 65 | 60 |
| Occurrences with product release | 60 | 41 | 76 | 41 | 23 | 19 | 23 | 26 | 17 | 13 | 20 |
| Persons fatally injured | 0 | 0 | 0 | 0 | 0 | 0 | 0 | 0 | 0 | 0 | 0 |
| Persons seriously injured | 0 | 0 | 1 | 0 | 0 | 0 | 0 | 0 | 0 | 0 | 0 |
| Accidents | 1 | 0 | 4 | 1 | 0 | 0 | 2 | 1 | 0 | 1 | 0 |
| Product released | 1 | 0 | 4 | 1 | 0 | 0 | 2 | 1 | 0 | 1 | 0 |
| Release of hydrocarbon gas | 1 | 0 | 0 | 1 | 0 | 0 | 1 | 1 | 0 | 1 | 0 |
| Release of HVP hydrocarbons1 | 0 | 0 | 1 | 0 | 0 | 0 | 0 | 0 | 0 | 0 | 0 |
| Release of LVP hydrocarbons2 | 0 | 0 | 2 | 0 | 0 | 0 | 0 | 0 | 0 | 0 | 0 |
| Release of other product | 0 | 0 | 1 | 0 | 0 | 0 | 1 | 0 | 0 | 0 | 0 |
| Release from line pipe body | 1 | 0 | 1 | 1 | 0 | 0 | 2 | 1 | 0 | 1 | 0 |
| Fire | 0 | 0 | 0 | 1 | 0 | 0 | 0 | 1 | 0 | 1 | 0 |
| Explosion | 0 | 0 | 0 | 1 | 0 | 0 | 0 | 1 | 0 | 1 | 0 |
| Rupture | 1 | 0 | 1 | 1 | 0 | 0 | 2 | 1 | 0 | 1 | 0 |
| Pipeline contacted by an object | 0 | 0 | 2 | 0 | 0 | 0 | 1 | 0 | 0 | 0 | 0 |
| Operation beyond limits | 0 | 0 | 0 | 0 | 0 | 0 | 0 | 0 | 0 | 0 | 0 |
| Geotechnical/hydrotechnical/environmental activity | 0 | 0 | 0 | 0 | 0 | 0 | 0 | 0 | 0 | 0 | 0 |
| Incidents | 100 | 101 | 128 | 110 | 52 | 84 | 114 | 66 | 68 | 64 | 60 |
| Product released | 59 | 41 | 72 | 40 | 23 | 19 | 21 | 25 | 17 | 12 | 20 |
| Release of hydrocarbon gas | 30 | 35 | 47 | 35 | 18 | 13 | 12 | 15 | 15 | 7 | 18 |
| Release of HVP hydrocarbons1 | 8 | 4 | 10 | 1 | 0 | 1 | 0 | 0 | 0 | 0 | 0 |
| Release of LVP hydrocarbons2 | 4 | 1 | 3 | 4 | 5 | 4 | 3 | 7 | 2 | 3 | 2 |
| Release of other product | 17 | 1 | 12 | 0 | 0 | 1 | 6 | 3 | 0 | 2 | 0 |
| Release from line pipe body | 5 | 5 | 3 | 7 | 1 | 1 | 9 | 6 | 2 | 4 | 4 |
| Fire | 5 | 4 | 8 | 4 | 3 | 4 | 9 | 6 | 10 | 5 | 3 |
| Explosion | 2 | 1 | 1 | 1 | 0 | 2 | 1 | 1 | 2 | 2 | 3 |
| Pipeline contacted by an object | 7 | 8 | 4 | 8 | 8 | 18 | 12 | 13 | 17 | 11 | 12 |
| Operation beyond limits | 27 | 34 | 20 | 13 | 5 | 4 | 2 | 8 | 6 | 9 | 2 |
| Geotechnical/hydrotechnical/environmental activity | 0 | 3 | 20 | 45 | 13 | 27 | 56 | 14 | 15 | 22 | 17 |
| Unauthorized third-party activity affecting pipeline structural integrity | 4 | 4 | 1 | 0 | 0 | 7 | 15 | 6 | 4 | 3 | 2 |
Data extracted 24 February 2026 1 HVP: high vapour pressure as defined in Canadian Standards Association Standard Z662. | |||||||||||
| 2015 | 2016 | 2017 | 2018 | 2019 | 2020 | 2021 | 2022 | 2023 | 2024 | 2025 | |
|---|---|---|---|---|---|---|---|---|---|---|---|
| Accidents | 1 | 0 | 4 | 1 | 0 | 0 | 2 | 1 | 0 | 1 | 0 |
| Newfoundland and Labrador | 0 | 0 | 0 | 0 | 0 | 0 | 0 | 0 | 0 | 0 | 0 |
| Prince Edward Island | 0 | 0 | 0 | 0 | 0 | 0 | 0 | 0 | 0 | 0 | 0 |
| Nova Scotia | 0 | 0 | 0 | 0 | 0 | 0 | 0 | 0 | 0 | 0 | 0 |
| New Brunswick | 0 | 0 | 0 | 0 | 0 | 0 | 1 | 0 | 0 | 0 | 0 |
| Quebec | 0 | 0 | 0 | 0 | 0 | 0 | 0 | 0 | 0 | 0 | 0 |
| Ontario | 0 | 0 | 0 | 0 | 0 | 0 | 0 | 0 | 0 | 0 | 0 |
| Manitoba | 0 | 0 | 0 | 0 | 0 | 0 | 1 | 0 | 0 | 0 | 0 |
| Saskatchewan | 0 | 0 | 1 | 0 | 0 | 0 | 0 | 0 | 0 | 0 | 0 |
| Alberta | 1 | 0 | 2 | 0 | 0 | 0 | 0 | 1 | 0 | 1 | 0 |
| British Columbia | 0 | 0 | 1 | 1 | 0 | 0 | 0 | 0 | 0 | 0 | 0 |
| Yukon | 0 | 0 | 0 | 0 | 0 | 0 | 0 | 0 | 0 | 0 | 0 |
| Northwest Territories | 0 | 0 | 0 | 0 | 0 | 0 | 0 | 0 | 0 | 0 | 0 |
| Nunavut | 0 | 0 | 0 | 0 | 0 | 0 | 0 | 0 | 0 | 0 | 0 |
| Incidents | 100 | 101 | 128 | 110 | 52 | 84 | 114 | 66 | 68 | 64 | 60 |
| Newfoundland and Labrador | 0 | 0 | 0 | 0 | 0 | 0 | 0 | 0 | 0 | 0 | 0 |
| Prince Edward Island | 0 | 0 | 0 | 0 | 0 | 0 | 0 | 0 | 0 | 0 | 0 |
| Nova Scotia | 2 | 3 | 0 | 2 | 0 | 1 | 0 | 0 | 0 | 0 | 0 |
| New Brunswick | 3 | 5 | 5 | 2 | 0 | 1 | 7 | 3 | 0 | 3 | 0 |
| Quebec | 8 | 7 | 6 | 1 | 5 | 8 | 10 | 1 | 1 | 7 | 9 |
| Ontario | 14 | 18 | 15 | 19 | 6 | 20 | 16 | 14 | 9 | 12 | 9 |
| Manitoba | 9 | 2 | 3 | 3 | 2 | 4 | 1 | 4 | 1 | 0 | 4 |
| Saskatchewan | 5 | 6 | 11 | 4 | 2 | 5 | 4 | 3 | 6 | 2 | 4 |
| Alberta | 27 | 37 | 36 | 32 | 22 | 29 | 28 | 24 | 36 | 31 | 22 |
| British Columbia | 30 | 22 | 52 | 47 | 12 | 15 | 47 | 16 | 12 | 8 | 10 |
| Yukon | 0 | 0 | 0 | 0 | 0 | 0 | 0 | 0 | 0 | 0 | 0 |
| Northwest Territories | 2 | 1 | 0 | 0 | 3 | 1 | 1 | 1 | 3 | 1 | 2 |
| Nunavut | 0 | 0 | 0 | 0 | 0 | 0 | 0 | 0 | 0 | 0 | 0 |
| Occurrences | 101 | 101 | 132 | 111 | 52 | 84 | 116 | 67 | 68 | 65 | 60 |
Data extracted 24 February 2026 | |||||||||||
| 2015 | 2016 | 2017 | 2018 | 2019 | 2020 | 2021 | 2022 | 2023 | 2024 | 2025 | |
|---|---|---|---|---|---|---|---|---|---|---|---|
| Accidents | 1 | 0 | 4 | 1 | 0 | 0 | 2 | 1 | 0 | 1 | 0 |
| Facilities | 0 | 0 | 2 | 0 | 0 | 0 | 0 | 0 | 0 | 0 | 0 |
| Compressor station | 0 | 0 | 0 | 0 | 0 | 0 | 0 | 0 | 0 | 0 | 0 |
| Gas processing plant | 0 | 0 | 1 | 0 | 0 | 0 | 0 | 0 | 0 | 0 | 0 |
| Meter station | 0 | 0 | 0 | 0 | 0 | 0 | 0 | 0 | 0 | 0 | 0 |
| Pump station | 0 | 0 | 0 | 0 | 0 | 0 | 0 | 0 | 0 | 0 | 0 |
| Storage facility | 0 | 0 | 0 | 0 | 0 | 0 | 0 | 0 | 0 | 0 | 0 |
| Terminal | 0 | 0 | 1 | 0 | 0 | 0 | 0 | 0 | 0 | 0 | 0 |
| Receipt/delivery facility | 0 | 0 | 0 | 0 | 0 | 0 | 0 | 0 | 0 | 0 | 0 |
| Other | 0 | 0 | 0 | 0 | 0 | 0 | 0 | 0 | 0 | 0 | 0 |
| Pipeline | 1 | 0 | 2 | 1 | 0 | 0 | 2 | 1 | 0 | 1 | 0 |
| Gathering line | 0 | 0 | 0 | 0 | 0 | 0 | 0 | 0 | 0 | 0 | 0 |
| Transmission line | 1 | 0 | 2 | 1 | 0 | 0 | 2 | 1 | 0 | 1 | 0 |
| Incidents | 100 | 101 | 128 | 110 | 52 | 84 | 114 | 66 | 68 | 64 | 60 |
| Facilities | 67 | 48 | 68 | 41 | 20 | 22 | 24 | 24 | 28 | 24 | 23 |
| Compressor station | 11 | 12 | 23 | 18 | 6 | 8 | 14 | 10 | 21 | 8 | 15 |
| Gas processing plant | 21 | 3 | 20 | 7 | 3 | 0 | 0 | 0 | 0 | 0 | 0 |
| Meter station | 7 | 16 | 7 | 6 | 3 | 2 | 1 | 3 | 2 | 7 | 1 |
| Pump station | 17 | 9 | 10 | 4 | 4 | 8 | 1 | 5 | 0 | 2 | 3 |
| Storage facility | 0 | 0 | 1 | 0 | 0 | 0 | 0 | 0 | 0 | 0 | 0 |
| Terminal | 10 | 5 | 6 | 6 | 3 | 3 | 3 | 3 | 4 | 5 | 3 |
| Receipt/delivery facility | 0 | 0 | 0 | 0 | 0 | 0 | 0 | 0 | 0 | 2 | 0 |
| Other | 1 | 3 | 1 | 0 | 1 | 1 | 5 | 3 | 1 | 0 | 1 |
| Pipeline | 33 | 53 | 60 | 69 | 32 | 62 | 90 | 41 | 40 | 40 | 37 |
| Gathering line | 5 | 3 | 8 | 11 | 3 | 1 | 0 | 0 | 1 | 0 | 1 |
| Transmission line | 28 | 50 | 52 | 58 | 29 | 61 | 90 | 41 | 39 | 40 | 36 |
| Occurrences | 101 | 101 | 132 | 111 | 52 | 84 | 116 | 67 | 68 | 65 | 60 |
Data extracted 24 February 2026 | |||||||||||
| 2015 | 2016 | 2017 | 2018 | 2019 | 2020 | 2021 | 2022 | 2023 | 2024 | 2025 | |
|---|---|---|---|---|---|---|---|---|---|---|---|
| Accidents | 1 | 0 | 4 | 1 | 0 | 0 | 2 | 1 | 0 | 1 | 0 |
| Incidents | 100 | 101 | 128 | 110 | 52 | 84 | 114 | 66 | 68 | 64 | 60 |
| Occurrences | 101 | 101 | 132 | 111 | 52 | 84 | 116 | 67 | 68 | 65 | 60 |
| Total length of operating pipelines1 (x1000 km) | 70.8 | 71.0 | 70.7 | 70.6 | 71.1 | 69.1 | 68.9 | 68.7 | 68.2 | 68.4 | 69.0 |
| Accidents per 1000 km of operating pipelines | 0.0 | 0.0 | 0.1 | 0.0 | 0.0 | 0.0 | 0.0 | 0.0 | 0.0 | 0.0 | 0.0 |
| Incidents per 1000 km of operating pipelines | 1.4 | 1.4 | 1.8 | 1.6 | 0.7 | 1.2 | 1.7 | 1.0 | 1.0 | 0.9 | 0.9 |
| Occurrences per 1000 km of operating pipelines | 1.4 | 1.4 | 1.9 | 1.6 | 0.7 | 1.2 | 1.7 | 1.0 | 1.0 | 1.0 | 0.9 |
| Total exajoules of energy transported1 (EJ) | 15.7 | 16.0 | 16.8 | 17.5 | 17.4 | 16.6 | 17.5 | 18.4 | 18.8 | 19.3 | 20.1 |
| Accidents per EJ | 0.1 | 0.0 | 0.2 | 0.1 | 0.0 | 0.0 | 0.1 | 0.1 | 0.0 | 0.1 | 0.0 |
| Incidents per EJ | 6.4 | 6.3 | 7.6 | 6.3 | 3.0 | 5.1 | 6.5 | 3.6 | 3.6 | 3.3 | 3.0 |
| Occurrences per EJ | 6.4 | 6.3 | 7.9 | 6.3 | 3.0 | 5.1 | 6.6 | 3.6 | 3.6 | 3.4 | 3.0 |
Data extracted 24 February 2026 1 Source: Canada Energy Regulator (CER; email communications 13 April, 2026). | |||||||||||
| 2015 | 2016 | 2017 | 2018 | 2019 | 2020 | 2021 | 2022 | 2023 | 2024 | 2025 | |
|---|---|---|---|---|---|---|---|---|---|---|---|
| Hydrocarbon gas | 31 | 35 | 47 | 36 | 18 | 13 | 13 | 16 | 15 | 8 | 18 |
| Gas - sour or acid | 10 | 2 | 7 | 6 | 1 | 0 | 0 | 0 | 0 | 0 | 0 |
| Natural gas | 21 | 33 | 40 | 30 | 17 | 13 | 13 | 16 | 15 | 8 | 18 |
| HVP hydrocarbons1 | 8 | 4 | 11 | 1 | 0 | 1 | 0 | 0 | 0 | 0 | 0 |
| Natural gas liquids / Liquefied petroleum gas | 8 | 4 | 11 | 1 | 0 | 1 | 0 | 0 | 0 | 0 | 0 |
| LVP hydrocarbons2 | 4 | 1 | 5 | 4 | 5 | 4 | 3 | 7 | 2 | 3 | 2 |
| Condensate | 0 | 0 | 1 | 0 | 0 | 1 | 0 | 0 | 0 | 0 | 0 |
| Condensate - sour | 0 | 0 | 0 | 0 | 0 | 0 | 0 | 0 | 0 | 0 | 0 |
| Crude oil | 3 | 1 | 4 | 3 | 5 | 3 | 3 | 7 | 2 | 3 | 1 |
| Crude oil - sour | 1 | 0 | 0 | 0 | 0 | 0 | 0 | 0 | 0 | 0 | 0 |
| Refined products | 0 | 0 | 0 | 1 | 0 | 0 | 0 | 0 | 0 | 0 | 1 |
| Other products3 | 17 | 1 | 13 | 0 | 0 | 1 | 7 | 3 | 0 | 2 | 0 |
| Other - unspecified | 16 | 1 | 0 | 0 | 0 | 0 | 0 | 0 | 0 | 0 | 0 |
| Other - gas | 1 | 0 | 1 | 0 | 0 | 0 | 0 | 0 | 0 | 0 | 0 |
| Other - liquid | 0 | 0 | 12 | 0 | 0 | 1 | 7 | 3 | 0 | 2 | 0 |
| Occurrences | 60 | 41 | 76 | 41 | 23 | 19 | 23 | 26 | 17 | 13 | 20 |
Data extracted 24 February 2026 1 HVP: high vapour pressure as defined in Canadian Standards Association Standard Z662. | |||||||||||
| 2015 | 2016 | 2017 | 2018 | 2019 | 2020 | 2021 | 2022 | 2023 | 2024 | 2025 | |
|---|---|---|---|---|---|---|---|---|---|---|---|
| Hydrocarbon gas | 31 | 35 | 47 | 36 | 18 | 13 | 13 | 16 | 15 | 8 | 18 |
| 100 m3 or less | 20 | 24 | 20 | 15 | 11 | 8 | 5 | 5 | 3 | 2 | 5 |
| 101 to 30 000 m3 | 7 | 10 | 25 | 17 | 4 | 3 | 3 | 7 | 10 | 3 | 10 |
| 30 001 to 100 000 m3 | 3 | 1 | 1 | 1 | 1 | 0 | 2 | 1 | 1 | 1 | 2 |
| 100 001 to 1 000 000 m3 | 0 | 0 | 1 | 2 | 2 | 1 | 3 | 1 | 1 | 0 | 1 |
| 1 000 001 to 10 000 000 m3 | 1 | 0 | 0 | 1 | 0 | 0 | 0 | 2 | 0 | 2 | 0 |
| Greater than 10 000 000 m3 | 0 | 0 | 0 | 0 | 0 | 1 | 0 | 0 | 0 | 0 | 0 |
| HVP hydrocarbons1 | 8 | 4 | 11 | 1 | 0 | 1 | 0 | 0 | 0 | 0 | 0 |
| 8 m3 or less | 8 | 4 | 10 | 1 | 0 | 1 | 0 | 0 | 0 | 0 | 0 |
| 9 to 25 m3 | 0 | 0 | 1 | 0 | 0 | 0 | 0 | 0 | 0 | 0 | 0 |
| 26 to 100 m3 | 0 | 0 | 0 | 0 | 0 | 0 | 0 | 0 | 0 | 0 | 0 |
| 101 to 1000 m3 | 0 | 0 | 0 | 0 | 0 | 0 | 0 | 0 | 0 | 0 | 0 |
| 1001 to 10 000 m3 | 0 | 0 | 0 | 0 | 0 | 0 | 0 | 0 | 0 | 0 | 0 |
| Greater than 10 000 m3 | 0 | 0 | 0 | 0 | 0 | 0 | 0 | 0 | 0 | 0 | 0 |
| LVP hydrocarbons2 | 4 | 1 | 5 | 4 | 5 | 4 | 3 | 7 | 2 | 3 | 2 |
| 1.5 m3 or less | 0 | 0 | 0 | 2 | 0 | 0 | 1 | 2 | 1 | 0 | 1 |
| 1.6 to 8 m3 | 2 | 1 | 1 | 2 | 4 | 0 | 1 | 3 | 1 | 2 | 1 |
| 9 to 25 m3 | 1 | 0 | 2 | 0 | 0 | 0 | 0 | 0 | 0 | 1 | 0 |
| 26 to 100 m3 | 1 | 0 | 1 | 0 | 1 | 3 | 0 | 1 | 0 | 0 | 0 |
| 101 to 1000 m3 | 0 | 0 | 0 | 0 | 0 | 1 | 0 | 1 | 0 | 0 | 0 |
| 1001 to 10 000 m3 | 0 | 0 | 1 | 0 | 0 | 0 | 0 | 0 | 0 | 0 | 0 |
| Greater than 10 000 m3 | 0 | 0 | 0 | 0 | 0 | 0 | 1 | 0 | 0 | 0 | 0 |
| Other products | 17 | 1 | 13 | 0 | 0 | 1 | 7 | 3 | 0 | 2 | 0 |
| 8 m3 or less | 14 | 0 | 12 | 0 | 0 | 1 | 3 | 0 | 0 | 0 | 0 |
| 9 to 25 m3 | 2 | 0 | 0 | 0 | 0 | 0 | 0 | 0 | 0 | 0 | 0 |
| 26 to 100 m3 | 0 | 0 | 0 | 0 | 0 | 0 | 0 | 3 | 0 | 1 | 0 |
| 101 to 1000 m3 | 1 | 1 | 1 | 0 | 0 | 0 | 4 | 0 | 0 | 1 | 0 |
| 1001 to 10 000 m3 | 0 | 0 | 0 | 0 | 0 | 0 | 0 | 0 | 0 | 0 | 0 |
| Greater than 10 000 m3 | 0 | 0 | 0 | 0 | 0 | 0 | 0 | 0 | 0 | 0 | 0 |
| Occurrences | 60 | 41 | 76 | 41 | 23 | 19 | 23 | 26 | 17 | 13 | 20 |
Data extracted 24 February 2026 1 HVP: high vapour pressure as defined in Canadian Standards Association Standard Z662. | |||||||||||
| No release of product | Release of hydrocarbon gas | Release of HVP hydrocarbons1 | Release of LVP hydrocarbons2 | Release of other product | ||||||
|---|---|---|---|---|---|---|---|---|---|---|
| Province or territory | 2015-2024 average | 2025 | 2015-2024 average | 2025 | 2015-2024 average | 2025 | 2015-2024 average | 2025 | 2015-2024 average | 2025 |
| Newfoundland and Labrador | 0.0 | 0 | 0.0 | 0 | 0.0 | 0 | 0.0 | 0 | 0.0 | 0 |
| Prince Edward Island | 0.0 | 0 | 0.0 | 0 | 0.0 | 0 | 0.0 | 0 | 0.0 | 0 |
| Nova Scotia | 0.1 | 0 | 0.7 | 0 | 0.0 | 0 | 0.0 | 0 | 0.0 | 0 |
| New Brunswick | 0.1 | 0 | 1.4 | 0 | 0.0 | 0 | 0.0 | 0 | 1.5 | 0 |
| Quebec | 5.0 | 8 | 0.4 | 1 | 0.0 | 0 | 0.0 | 0 | 0.0 | 0 |
| Ontario | 11.3 | 5 | 2.5 | 4 | 0.3 | 0 | 0.1 | 0 | 0.1 | 0 |
| Manitoba | 1.3 | 3 | 0.6 | 0 | 0.4 | 0 | 0.7 | 1 | 0.0 | 0 |
| Saskatchewan | 2.6 | 4 | 0.6 | 0 | 0.9 | 0 | 0.7 | 0 | 0.1 | 0 |
| Alberta | 19.7 | 13 | 8.7 | 8 | 0.3 | 0 | 1.9 | 1 | 0.1 | 0 |
| British Columbia | 15.0 | 5 | 8.2 | 5 | 0.4 | 0 | 0.2 | 0 | 2.5 | 0 |
| Yukon | 0.0 | 0 | 0.0 | 0 | 0.0 | 0 | 0.0 | 0 | 0.0 | 0 |
| Northwest Territories | 0.7 | 2 | 0.1 | 0 | 0.2 | 0 | 0.2 | 0 | 0.1 | 0 |
| Nunavut | 0.0 | 0 | 0.0 | 0 | 0.0 | 0 | 0.0 | 0 | 0.0 | 0 |
| Occurrences | 55.8 | 40 | 23.2 | 18 | 2.5 | 0 | 3.8 | 2 | 4.4 | 0 |
Data extracted 24 February 2026 1 HVP: high vapour pressure as defined in Canadian Standards Association Standard Z662. | ||||||||||
Definitions
Before 1 July 2014
Before 1 July 2014 (under the previous Transportation Safety Board Regulations [TSB Regulations]), pipeline transportation accidents and incidents were defined as follows:
Pipeline accidents
Reportable commodity pipeline accident means an accident resulting directly from the operation of a commodity pipeline, where
- a person sustains a serious injury or is killed as a result of being exposed to
- a fire, ignition or explosion, or
- a commodity released from the commodity pipeline, or
- the commodity pipeline
- sustains damage affecting the safe operation of the commodity pipeline as a result of being contacted by another object or as a result of a disturbance of its supporting environment,
- causes or sustains an explosion, or a fire or ignition that is not associated with normal operating circumstances, or
- sustains damage resulting in the release of any commodity.
Pipeline incidents
Reportable commodity pipeline incident means an incident resulting directly from the operation of a commodity pipeline, where
- an uncontained and uncontrolled release of a commodity occurs,
- the commodity pipeline is operated beyond design limits,
- the commodity pipeline causes an obstruction to a ship or to a surface vehicle owing to a disturbance of its supporting environment,
- any abnormality reduces the structural integrity of the commodity pipeline below design limits,
- any activity in the immediate vicinity of the commodity pipeline poses a threat to the structural integrity of the commodity pipeline, or
- the commodity pipeline, or a portion thereof, sustains a precautionary or emergency shut-down for reasons that relate to or create a hazard to the safe transportation of a commodity;
Since 1 July 2014
On 1 July 2014, new reporting provisions of the TSB Regulations came into effect; these were subsequently revised effective 22 November 2018 and appeared in the Canada Gazette 12 December 2018. According to subsection 4(1) of the TSB Regulations, the operator of a pipeline must report any of the following pipeline occurrences to the Board:
- the pipeline sustains damage that affects the safe operation of the pipeline as a result of another object coming into contact with it;
- an unauthorized third party activity affects the structural integrity of the pipeline;
- a geotechnical, hydrotechnical or environmental activity poses a threat to the safe operation of the pipeline.
Under subsection 4(1.1), the operator must report any of the following pipeline occurrences to the Board if they result directly from the operation of the pipeline:
(a) a person sustains a serious injury as defined in section 1 of the National Energy BoardOn 28 August 2019, the National Energy Board became the Canada Energy Regulator. Onshore Pipeline Regulations or is killed;
(b) there is a fire, ignition or explosion that
(i) affects the safe operation of the pipeline, or
(ii) poses a threat to the safety of any person, property or the environment;
(c) there is an occurrence that results in
(i) an unintended or uncontrolled release of hydrocarbon gas,
(ii) an unintended or uncontrolled release of HVP hydrocarbons,
(iii) an unintended or uncontrolled release of LVP hydrocarbons in excess of 1.5 m3, or
(iv) an unintended or uncontrolled release of a commodity other than hydrocarbon gas, HVP hydrocarbons or LVP hydrocarbons;
(d) there is a release of a commodity from the line pipe body;
(e) the pipeline is operated beyond design limits or any operating restrictions imposed by the National Energy Board6;
(f) the pipeline restricts the safe operation of any mode of transportation.
Since 1 May 2018
Since 1 May 2018, the TSB Policy on Occurrence Classification defines Pipeline accidents and Pipeline incidents as follows:
Pipeline accidents
A pipeline accident is an occurrence resulting directly from the operation of a pipeline that results in:
- serious injury or loss of human life;
- a rupture (an instantaneous release that immediately affects the operation of a pipeline segment such that the pressure of the segment cannot be maintained);
- a fire, ignition or explosion that poses a threat to the safety of any person, property or the environment; or
- an unintended or uncontrolled release of commodity which results in a significant adverse effect on people or the environment (a release of any chemical or physical substance at a concentration or volume sufficient to cause an irreversible, long-term, or continuous change to the ambient environment in a manner that causes harm to human life, wildlife, or vegetation).
Pipeline incidents
A pipeline incident is
- an occurrence in which
- the pipeline sustains damage that affects the safe operation of the pipeline as a result of another object coming into contact with it,
- an unauthorized third party activity affects the structural integrity of the pipeline, or
- a geotechnical, hydrotechnical or environmental activity poses a threat to the safe operation of the pipeline;
- an occurrence resulting directly from the operation of a pipeline in which
- there is a fire, ignition or explosion that affects the safe operation of the pipeline,
- there is an unintended or uncontrolled release of hydrocarbon gas,
- there is an unintended or uncontrolled release of HVP (high vapour pressure as defined in CSA Z662. CSA Z662 means Canadian Standards Association Standard Z662, entitled Oil and Gas Pipeline Systems, as amended from time to time) hydrocarbons,
- there is an unintended or uncontrolled release of LVP (low vapour pressure as defined in CSA Z662) hydrocarbons in excess of 1.5 m3,
- there is an unintended or uncontrolled release of a commodity other than hydrocarbon gas, HVP hydrocarbons or LVP hydrocarbons,
- there is a release of a commodity from the line pipe body,
- the pipeline is operated beyond design limits or any operating restrictions imposed by the Canada Energy Regulator, or
- the pipeline restricts the safe operation of any mode of transportation.